Disclaimer: This blog post was written by an external contributor about Uber’s open-source Orbit library for time series forecasting and its applications to marketing mix modeling. The approach laid out in this document is not reflective of how Recast approaches time series forecasting and modeling time-varying effects. The actual model specification can be found in the technical model specification.
Forecasting isn’t a hobby at Uber, it’s core to their business. Time series models help Uber predict demand so they know where to send their drivers, forecast hardware and computation requirements so their servers don’t go down, and allocate billions of dollars in annual marketing budget, the use case we are most interested in. Marketing effectiveness is a serious topic at Uber, having been the victim of over $100m in ad fraud in 2017, resulting in a lawsuit against Fetch Media, their former agency.
When a company that’s this serious about forecasting and attribution releases an open-source time series forecasting library, it pays to take notice. Uber’s Orbit library, like others we’ve reviewed – Meta Robyn, Google LightweightMMM – is freely available, and impressively powerful. It was introduced in May 2021, but has garnered more interest recently as the impact of iOS14 have continued to be felt, practitioners have started to learn more about Marketing Mix Modeling and test it out on their own use cases.
The team released a paper entitled “Bayesian Time Varying Coefficient Model with Applications to Marketing Mix Modeling“ by E. Ng, Z. Wang, & A. Dai, showcasing how it was possible to use Uber Orbit for MMM, though it’s important to note that it’s not strictly an MMM tool. It lacks basic features like Saturation and Adstocks, and is more akin to Meta’s Prophet time series forecasting library, than a direct comparison to Meta’s Robyn (which uses Prophet under the hood to establish seasonal patterns). What this model does have, which has everyone excited, is Bayesian Time-Varying Coefficients (BTVC). This is the first and biggest open use of this advanced technique, though several vendors including ourselves at Recast, use it as a core functionality.
In business terms, what this allows you to do is have the performance of marketing change over time. Something that isn’t native to Robyn, LightweightMMM, or any other popular open-source MMM library, who all assume marketing performance remains unchanged across the modeling time period. That assumption rarely holds water with executives, because *of course* marketing performance changes over time: what are they paying you for if not? Given the popularity of Meta and Google’s contributions to the MMM field, we thought it would be a good exercise to lay out exactly how Uber’s tool works.
Just like our reviews of Robyn and LightweightMMM, this isn’t one of those “Us vs Competitor” posts: Uber Orbit is free, which makes it a better choice over Recast in many scenarios, much like Google Analytics is a better choice for most brands than a paid for tool like Amplitude or Mixpanel. However, where we do things differently, we won’t hold back on explaining why we do it that way. Because it’s open-source, anyone can look at the code and see exactly how Orbit works. This transparency helps a lot when you’re dealing with a highly technical topic like marketing attribution, and we can all learn from Uber’s contribution.
What are Bayesian Time-Varying Coefficients?
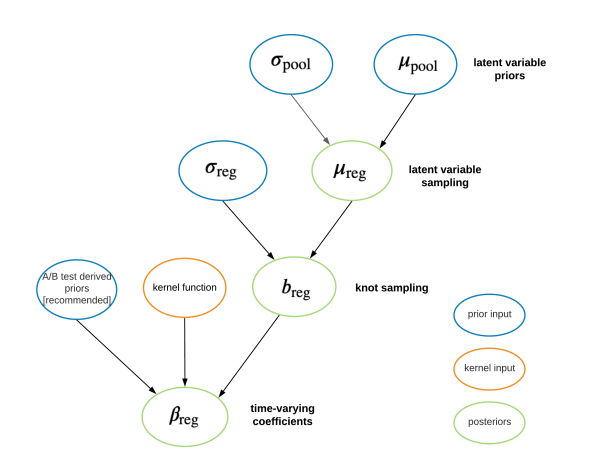
Uber’s Orbit model is Bayesian, like Google’s LightweightMMM and our own model at Recast. One benefit of Bayesian models is the use of Priors, which offer a flexible mechanism for incorporating existing knowledge to direct the model to more plausible results. With Orbit, this mechanism is used to let coefficients – the parameters of the model that tell you how effective your marketing is – to vary over time, while still staying internally consistent.
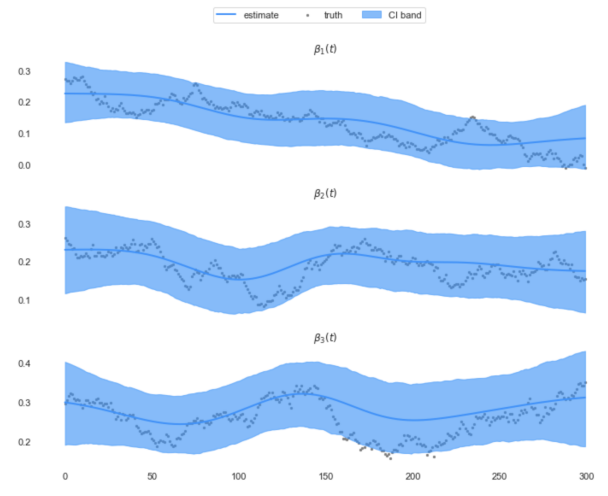
What this means in practice is that rather than a single answer to “what is the ROI of this channel”, you get a range of answers over time. This is a huge limitation of traditional marketing mix models, because they do not allow for this. In a traditional MMM you get one answer for the ROI of each channel across the whole time period. This can be good enough for channels like linear television where the media buys happen up front, but isn’t a good assumption for dynamic bid-based channels like paid search or paid social.
Imagine the following scenarios:
- Apple releases a change to tracking that impacts a channel’s ability to target
- A pandemic sweeps the world and impacts people’s buying behavior
- Performance has been improving over time with optimization
- Rising competition has been eroding the channel’s effectiveness
- Demand temporarily spikes in peak season, then goes back to normal
If you were to build a traditional marketing mix model, you have the potential of being seriously wrong in each of these situations. The failure to capture changes in marketing performance over time leads econometricians to control for seasonality (i.e. separate the effect), leaving them with only a theoretical view of how marketing would work in a world without holidays, weather, or market trends. They get the right answer to the wrong question, and this leads to serious underspending at peak periods: precisely when there’s an opportunity to get better performance.
How long does it take Orbit to run?
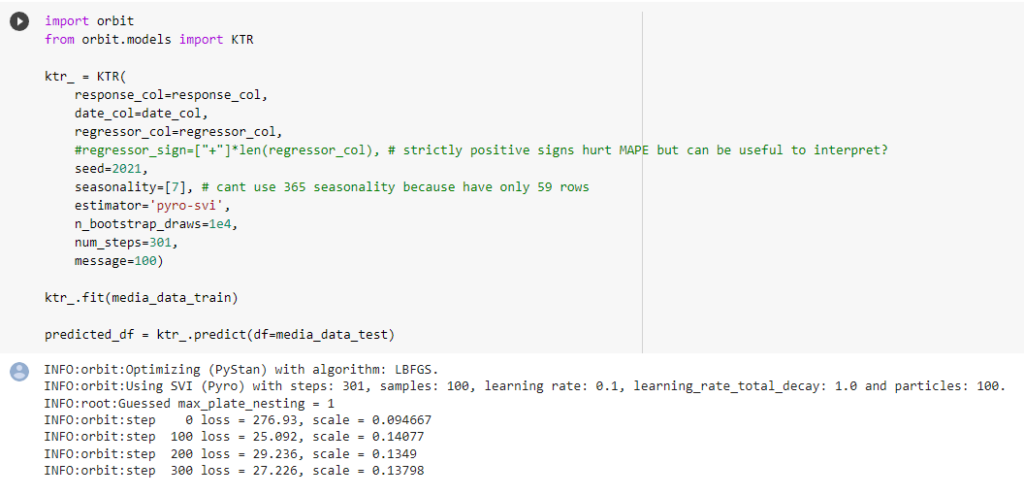
Uber Orbit is a Python library, like Google’s LightweightMMM, but unlike Meta Robyn which uses R. Under the hood Orbit uses Stan for probabilistic modeling (the same library we use at Recast – in fact we have several core Stan contributors on our team) as well as Pyro for computation which is similar to what’s used in Google’s LightweightMMM. Being a Bayesian model, all of the parameters are estimated at once, so there’s no significant hyperparameter optimization step like you have to wait for with Meta Robyn, which uses a separate evolutionary library called Nevergrad to do this task. So in my experience it only takes about 10 minutes to run on a model with 5-10 variables and a year’s worth of data. Much like Google, though not like Meta, Uber also isn’t using tools like Prophet to separately predict seasonality, it’s just handled natively as part of the model. Prophet itself uses Bayesian techniques and is a time series forecasting tool just like Orbit.
Orbit optimizes the model based on accuracy alone as measured by SMAPE – Symmetric Mean Absolute Percentage Error, or how wrong the model is on the average day / week, similar to Google’s use of MAPE. In contrast to the mean absolute percentage error, SMAPE has both a lower bound and an upper bound. However many find MAPE easier to interpret. This measure is less advanced than Robyn, which by default also optimizes Decomp.RSSD – a metric they invented – that tells us how far away the model is from the current spend allocations. This was a controversial but important invention by the Facebook team, because it helps make the model more plausible, i.e. it won’t recommend really big changes in ad spend, or say that one small channel drove the majority of ROI.
How long does it take to build a model with Orbit?
Uber’s project is less developed for the specific Marketing Mix Modeling use case than Meta’s, so there is no supporting documentation on MMM like there is on the Robyn site. Both projects accept the data in exactly the same way, so defining business scope, collecting and cleaning the data, presenting the results will take equally as long, approximately 8 to 14 weeks. If you’re undergoing a project to build an MMM using Robyn, it won’t take more than an additional day or so to run Uber Orbit and LightweightMMM as well, and compare the results. However if you want the same visualizations as Robyn, and to include the ability to find saturation and adstock parameters, that could take weeks to months of additional custom coding and testing. Orbit is a substantial step up from simple linear regression in Excel, but it’s lacking the core features necessary for a true MMM.
Is it possible to get Orbit running on a daily basis?
Because the Orbit code is open-source, you can just take that code and run it on your own server if you like. If you do decide to self-host Uber Orbit, the server costs will be relatively negligible on AWS or Google Cloud, so really the main cost is the data engineering to get it set up. In talking to consultants who have helped clients set up similar infrastructure for Robyn, this tends to be in the ballpark of $5,000-$10,000 as a one off cost – primarily to set up the data pipelines to get the data all in one place for modeling. Although additional cost can be significantly higher with custom requirements or additional visualizations / feature development (it took us 2 years of R&D to get our model working at Recast!).
Different brands have different needs based on the state of their data, what systems it needs to be collected from and in what format, and how complex their marketing mix is. Making the build vs buy decision depends mainly on your in-house resources: nobody has a lot of engineers and data scientists lying around doing nothing, but if your team is technically strong in this area it can be feasible. This is by far the hardest part to be honest: we’ve talked about in the past how hard this problem is to solve. Like any software project you’ll need a team on hand for further upgrades and fixing bugs, as well as any changes you want to make to the base code or front-end data visualizations.
Outside of the technical hurdle to set Orbit up to run daily (or weekly), it does have an advantage over the other open source libraries in terms of stability, making it the prime candidate for reliable ongoing reporting. With Robyn and LightweightMMM you’ll be dealing with dramatic parameter shifts when your model is run with new data, whereas Orbit is built to handle those shifts gracefully as a core part of its model, with the Bayesian Time-Varying Coefficients functionality. Dramatic shifts can still happen, but it’s less likely you’ll go from saying that a campaign was super effective to super ineffective from one day to the next just because the underlying data changed slightly. However this is something you may want to have a smart analyst watching for. And of course, it’s easy to go too far in the wrong direction where you set your priors tightly to avoid a change in results, but then you miss a real change where a channel has actually gotten a lot worse or better over a short period of time.
How does Uber Orbit estimate the adstocks and diminishing returns of advertising?
Short answer: it doesn’t! This is by far the biggest weakness of the Uber Orbit model, and it makes it mostly unusable for many brands for whom seeing the impact of increases of ad spend on efficiency and lagged performance is the main reason they build MMMs. The paper does mention adstocks once, as a hyperparameter they set up within their internal Michelangelo system for running models, so the team likely does account for these effects internally. However as it stands it isn’t clear to anyone but an advanced expert how to actually incorporate these parameters into your own models built on Orbit.
How does Orbit account for seasonality?
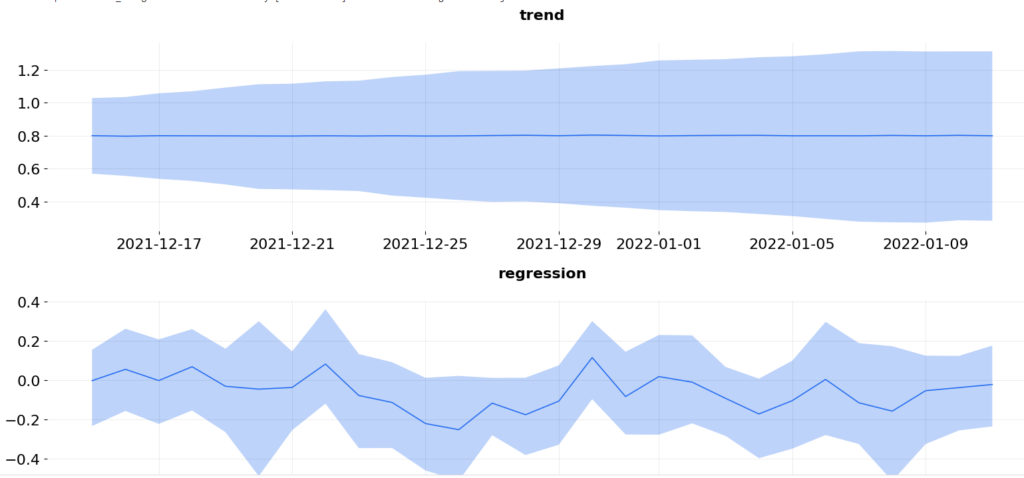
Orbit, like LightweightMMM, accounts for seasonality natively in the model, with a sinusoidal parameter with a repeating pattern from a Fourier analysis. There’s also an Intercept (a baseline variable) which is standard practice, as well as trend and error terms. This is not so different from what Facebook does, where they use the Bayesian open-source library Prophet, that automatically separates out the annual seasons from the general underlying trend, and adds holidays and other events based on the country the model is being built for.
Note that there are a minimum of 52 weekly observations to do week of year seasonality in your training data (so you need more like a year plus four weeks worth of data so there’s a holdout group for testing). If you don’t have a full year of data you can still calculate a day of week seasonality and underlying trend.
Is it possible to calibrate Orbit with our domain knowledge?
Being Bayesian the library does allow for incorporating domain knowledge. This is something that natively works well within Bayesian frameworks, and you can see in the documentation and accompanying paper the team puts a great deal of emphasis on calibrating the model with the results of lift tests. You can use the results of these tests as the ‘ground truth’ of what performance really was during specific periods for specific channels, and incorporate that in the priors of each parameter so that it ‘pins down’ the model to that reality. While incorporating all of the strong or weakly held opinions you have about the nature of how each channel will perform, the model will calculate what performance is likely to be given those assumptions.
At Recast, We use an algorithm called Bayesian Markov Chain Monte-Carlo, just like LightweightMMM and Orbit use. However we’ve built more flexibility into our model in terms of what data and business knowledge we incorporate to arrive at the correct model. It can be as simple as defining that marketing spend can never drive negative sales, or as complex as incorporating your other attribution methods into the model as priors, so that the resulting model is consistent with what you know and you get a single source of truth you can rely on. Our model uses thousands of parameters to arrive at that truth, and to do so automatically without intervention, but philosophically we’re the most similar to Uber’s approach given both of us emphasize time-varying coefficients.
Can we use Orbit to understand recent performance?
Given how much we’ve talked about Time-Varying Coefficients, you may suspect the answer. Yes! Uber is by far the best at this of all of the publicly available and open-source libraries. If you suspect that your performance has changed over time, and you’re currently using Robyn or LightweightMMM, we seriously suggest you give Uber Orbit a try. It might have deficiencies in the area of adstocks or saturation curves, but often time variance is the bigger problem.
What recommendations can Orbit give me to help with decision making?
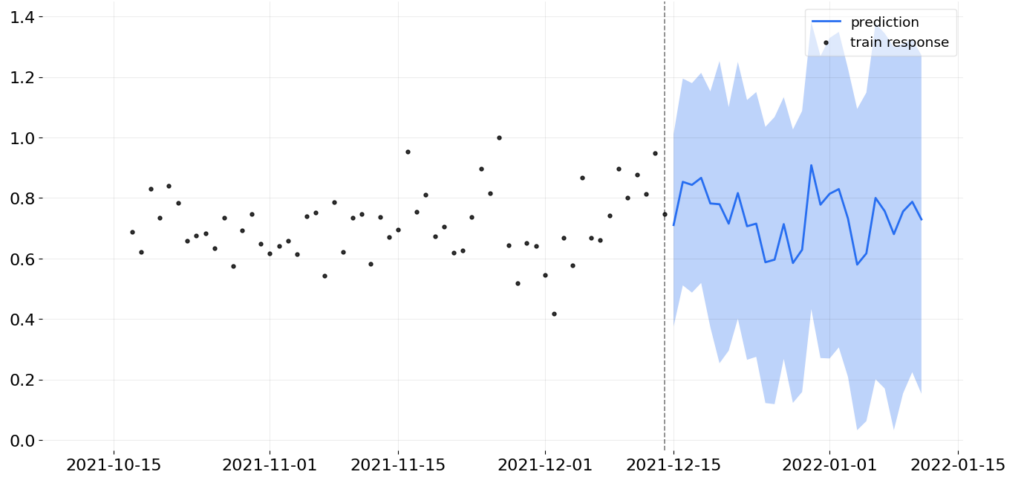
Orbit has some of the standard output you’d expect from an MMM, but it’s missing quite a few visualizations compared to Robyn, which is the market leader for interpretation of results. For example there’s no waterfall chart of contribution by channel, or share of effect versus share of spend, both of which are standard in Robyn (and Recast!). There are mainstays of MMM such as accuracy vs predicted, and they go the extra mile here and provide both in-sample (data we fed to the model to train it) and out-of sample (data the model hasn’t seen yet) charts and accuracy metrics, which helps quickly diagnose how reliable the model is.
As there are no diminishing returns / saturation effects in the model, there are also no response curves. This is a big oversight as we can’t tell where each channel starts to get saturated, which is a big strategic disadvantage compared to Robyn and LightweightMMM which do this very well. There is also no media optimizer, so we’d have to code our own, for example we could use Nevergrad by Meta, or adapt Google’s LightweightMMM media optimizer to determine where our budget could be spent. Of course all of this is meaningless without saturation curves, so that would need to be custom coded first before you could allocate budget effectively.
In Recast we have these various components available in a dashboard, for our clients to look at, updated daily. Of course it is possible to put Orbit in production and build your own dashboards, but this takes a fairly significant investment in data engineering, data visualization, and data science if you’re making updates to the way the core model works.. As their code is open source this can be a good solution if you have extra data science and engineering resources.