Facebook (Meta) bet on Marketing Mix Modeling (MMM) to save their ads business, after Apple’s iOS14 update gave users the right to choose if they’ll accept tracking. Because it uses aggregate data, MMM doesn’t need to invade anyone’s privacy to work, so it’s future-proof to any changes in the rules, whether they come from Apple or government legislation. However this technique is hard to get right, and can be vulnerable to bias – your model is only as honest as your modeler.
When Facebook entered the MMM scene, they knew they couldn’t just release a proprietary tool: nobody would trust them to grade their own homework. So they released Robyn as an open-source library, which means it’s free for anyone to use, so long as you know how to code in R (a programming language popular among statisticians). Because it’s open-source, anyone can look at the code and see exactly how Robyn works. This transparency helps a lot when you’re dealing with a highly technical topic like marketing attribution.
Given that many of our clients tried out Robyn before deciding on Recast (and in some cases, still run it alongside), we figured it would be a good exercise to lay out exactly how it works. This isn’t one of those “Us vs Competitor” posts: Robyn is free, which makes it a better choice over Recast in many scenarios, much like Google Analytics is a better choice for most brands than a paid for tool like Amplitude or Mixpanel. However, where we do things differently, we won’t hold back on explaining why we do it that way.
How long does it take Robyn to run?
Robyn with its default configuration is building 10,000 models for you, which typically takes about 2-3 hours on your computer. This is assuming you have around 5 media channels, which translates to approximately 20-30 parameters to optimize.
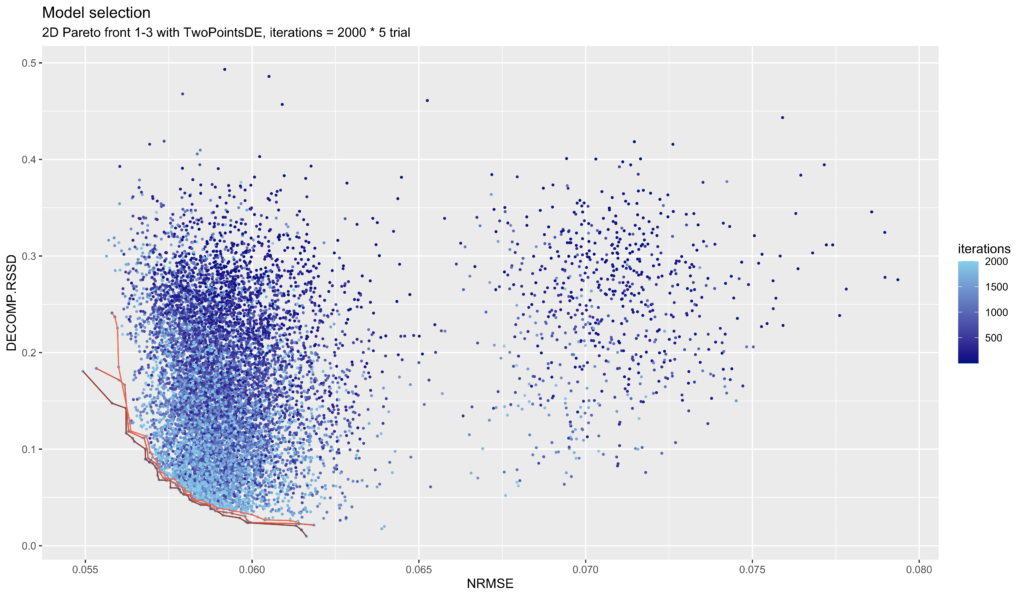
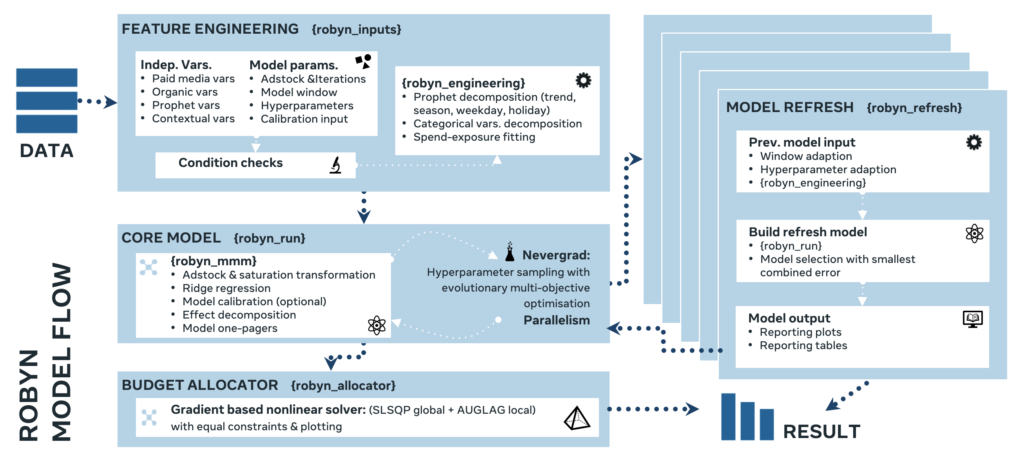
Robyn uses Nevergrad, an evolutionary optimization algorithm (itself a Facebook open source project), to automatically find the right combination of parameters for your model from those 10,000 attempts. It decides which model is ‘best’ by optimizing for two metrics: Decomp.RSSD, and NRMSE.
- NRMSE: Normalized Root Mean Square Error. The error, or difference between predicted and actual sales, squared then averaged before finding the square root and normalized so that larger errors are penalized more. This is a standard modeling accuracy metric.
- Decomp.RSSD: Decomposition Root Sum of Squared Distance. The distance between Effect Share (how many sales the model says a channel drove) and Spend Share (how much was spent on a channel). This metric was invented by Facebook and is controversial – it’s effectively optimizing to not telling the marketers that they were wrong!
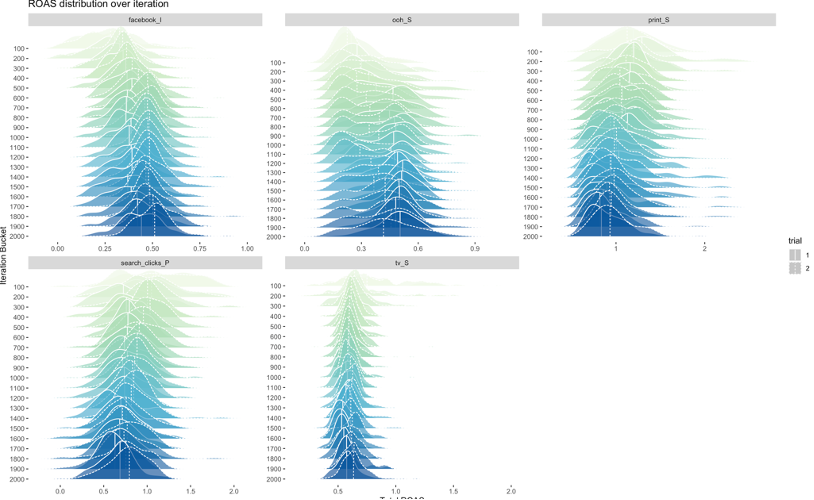
After Robyn has completed the automated optimization phase, you’re not quite down to the final model: usually you have about 100 models that were on the Pareto Frontier: the best possible combinations of NRMSE and Decomp.RSSD (they couldn’t improve on one without sacrificing the other). It’s up to the analyst to choose from these final models, which can in some cases be quite different in terms of what they say about relative channel performance. We recommend manually reviewing these models and choosing the most plausible one, i.e. the one where channel performance makes the most sense, based on what you know about the business. The ROAS distribution over iteration chart that Robyn produces is useful for seeing these difference at a glance.
Note that it actually just uses Nevergrad for optimizing the hyperparameters, namely what saturation rates (diminishing returns) or adstocks (lagged effect) each media channel has. The core model parameters, i.e. the return on ad spend for each channel, is modeled using Ridge Regression. This statistical technique penalizes or shrinks variables if they aren’t as significant in the model, and it’s a strategy for dealing with feature selection (deciding what goes in the model) and multicollinearity (multiple variables correlating with each other). Often when you run Robyn it’ll tell you that some channels had zero effect (which can be hard to explain!).
How long does it take to build a model with Robyn?
The Facebook team have actually produced a helpful guide for how long marketing mix modeling projects typically take. They say that the data collection and cleaning phase can take 6 to 10 weeks. Then after that they estimate the actual modeling will take 4 to 8 weeks (dependent on MMM scope), with a further 2 to 4 weeks for analysis and recommendations.
- Define business questions and scope: 1-2 weeks
- Data collection: 4-6 weeks
- Data review: 1-2 weeks
- Modeling: 4-8 weeks
- Analysis and recommendations: 2-4 weeks
Overall we think this seems long, though it’s not an unusual timeline for a Fortune 500 brand, who usually runs this cycle once or twice a year. In our own work building MMMs, we’ve seen that the data collection and cleaning phase can be as low as half a day, for a simple model, or 1-2 weeks for a more complex scaleup.
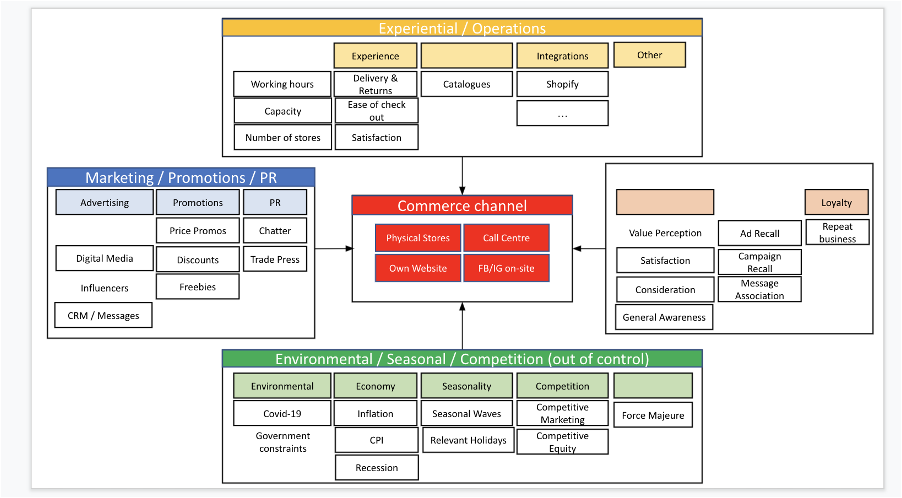
One reason that the data collection phase takes so long here is because Facebook encourages analysts to incorporate lots of “external” data into their model. We actually think that this is wrong from a statistical perspective and makes the process of doing MMM much more difficult!
Is it possible to get Robyn running on a daily basis?
Because the Robyn code is open-source, it’s completely legal to just take that code and run it on your own server. In fact we’ve heard several providers plan to simply reskin Robyn and offer it as a paid tool. If you decide to self-host Robyn, the server costs will be relatively negligible on AWS or Google Cloud, so really the main cost is the data engineering to get it set up. In talking to consultants who have helped clients set up Robyn this tends to be in the ballpark of $5,000-$10,000 as a one off cost – primarily to set up the data pipelines to get the data all in one place for modeling.
Different brands have different needs based on the state of their data, what systems it needs to be collected from and in what format, and how complex their marketing mix is. This is the hardest part to be honest: it’s why we have to maintain a waitlist for new clients as we handle all of this for them as standard. Like any software project you’ll need a developer on hand for updates and when anything goes wrong, and any changes you want to make to the base code or front-end data visualizations.
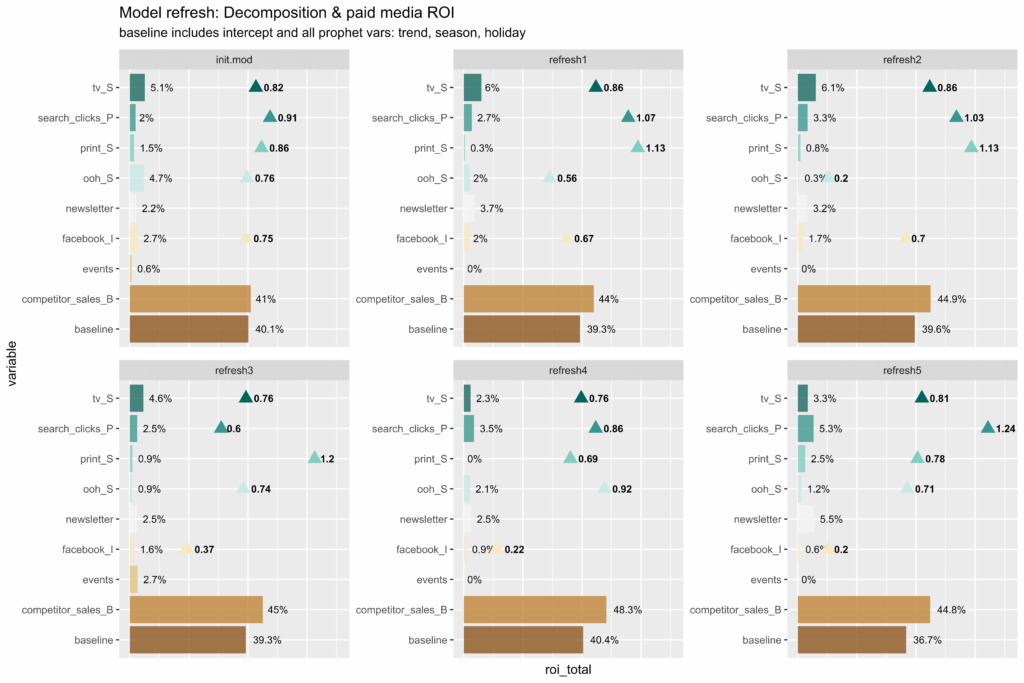
Outside of the technical hurdle to set Robyn up to run daily (or weekly), the real issue is going to be dealing with dramatic parameter shifts when your model is run with new data. If you aren’t careful, you can go from saying that a campaign was super effective to super ineffective from one day to the next just because the underlying data changed slightly. The example given in Robyn’s documentation shows Facebook performance going from 0.75 return on ad spend to 0.2 over the course of 5 model refreshes, from 2.7% of sales down to 0.6%. Of course it is possible that performance of a channel can degrade significantly, but it’s something you want to have a smart analyst watching for.
How does Robyn estimate the adstocks and diminishing returns of advertising?
This is where the bulk of the 2-3 hours runtime is going: finding the right value for the adstocks and saturation of media channels.
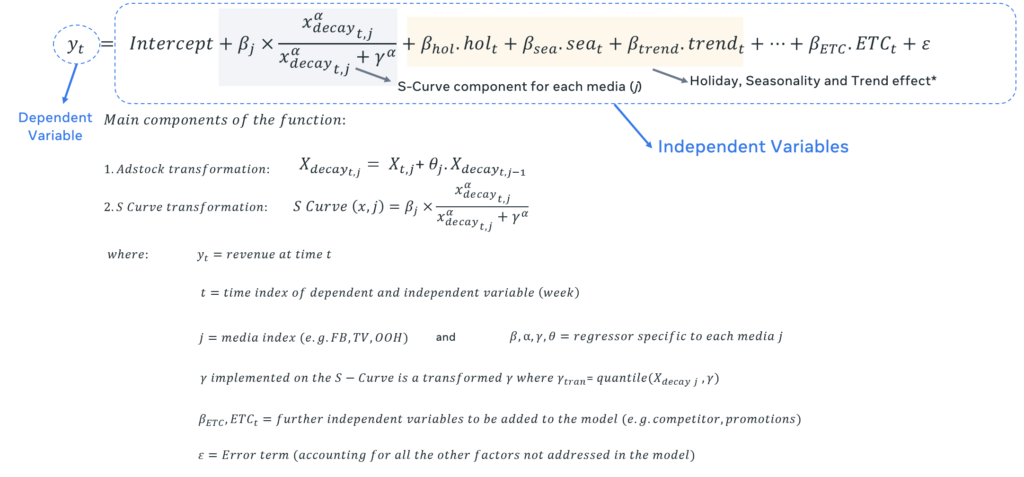
There are two options of adstock, which help you model the carryover (lagged) effect of advertising. The default is Geometric, which has one parameter called decay (the amount that gets carried over from yesterday to today). There are also Weibull adstocks which have a more advanced shape, and therefore need two parameters: decay and alpha. This is what we use at Recast, as it offers more flexibility and better accuracy, though using this option with Robyn can increase runtime 30-40% because of the additional parameters to search over.
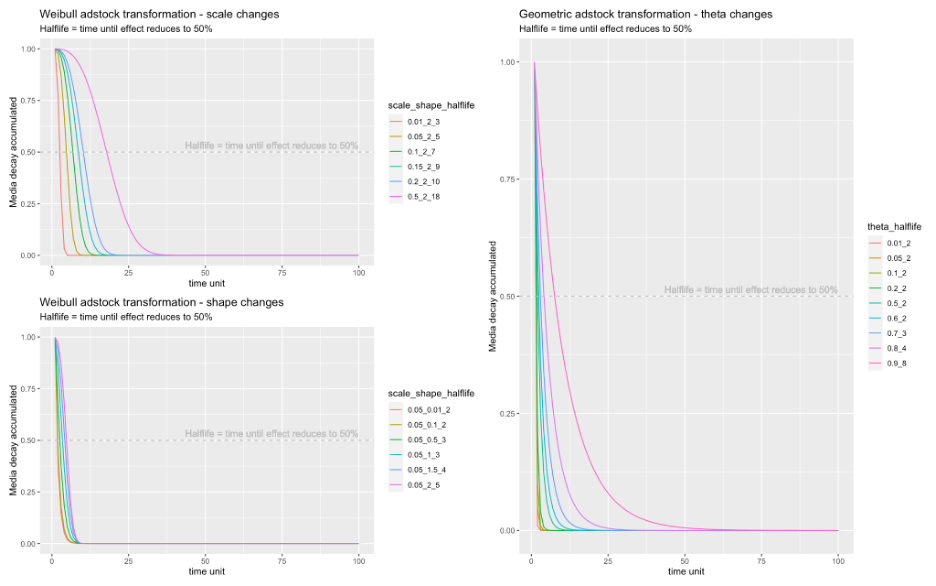
We believe, like the Robyn team, that the Weibull distribution is superior because it allows you to model marketing channels where the peak effect might not be on the day when the spend happens. This is really important for channels like direct mail and podcasts where it takes time for the marketing to reach customers.
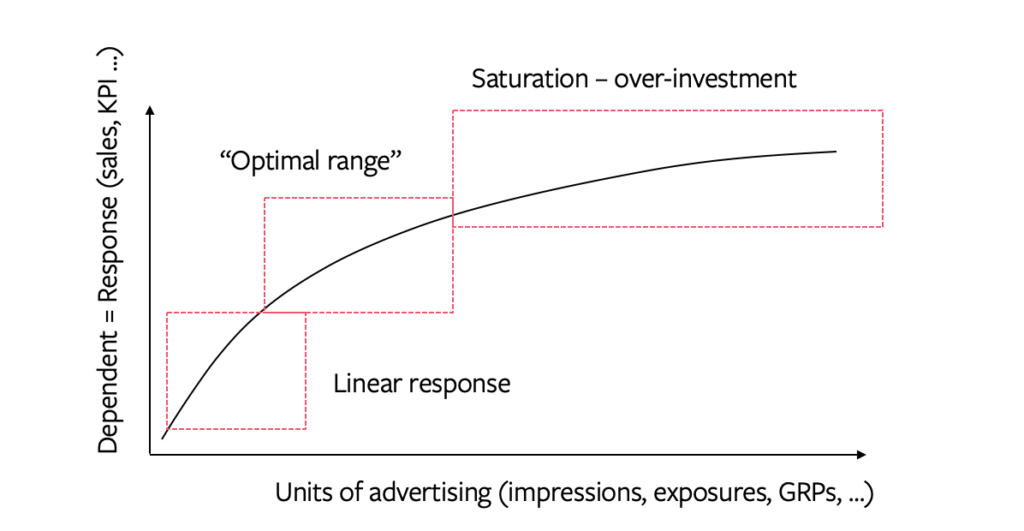
For diminishing returns Robyn has one option, the S-Curve, with 2 parameters: alpha and gamma. Alpha controls the shape of the diminishing returns curve (how fast a channel saturates) and Gamma controls the inflection point (when a channel hits saturation).
How does Robyn account for seasonality?
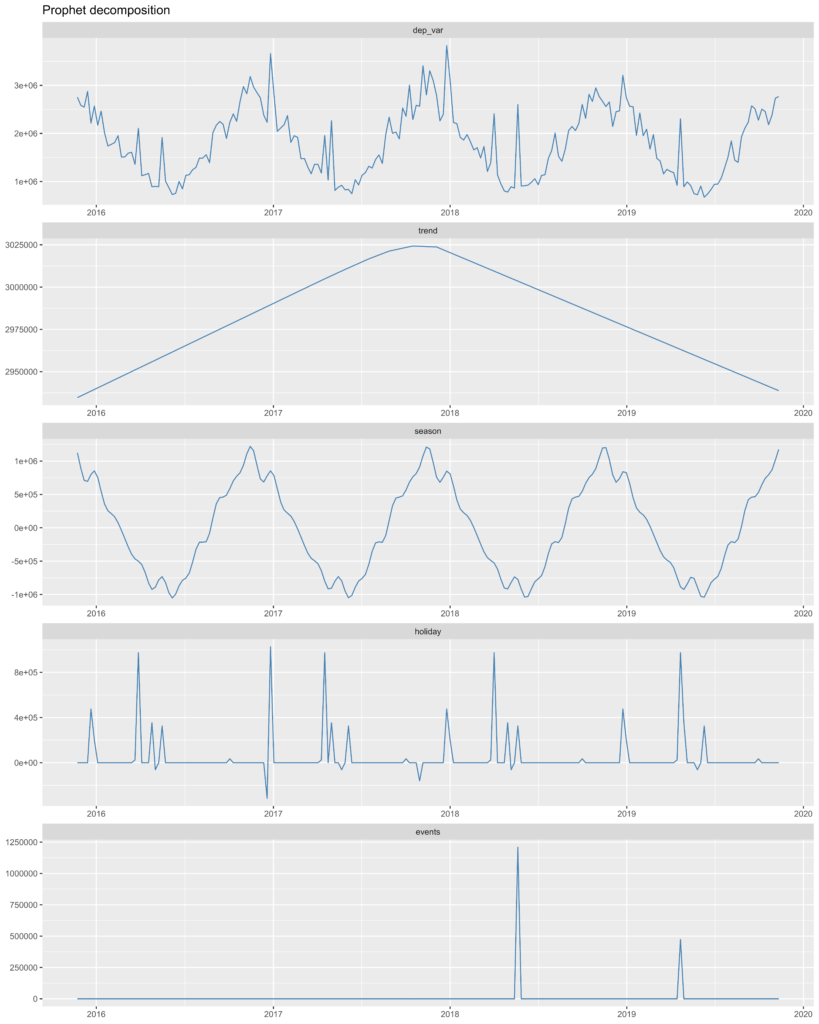
Facebook uses another open-source they created called Prophet, which automatically separates out the annual seasons from the general underlying trend, and adds holidays and other events based on the country the model is being built for. These are included as variables in the model to control for seasonality. This is a standard approach that we happen to think is completely wrong: controlling for seasonality means assuming your marketing performance doesn’t change in periods of peak demand! Blindly following a model like this will lead to the wrong conclusions, like under-spending during key holidays like Black Friday.
Is it possible to calibrate Robyn with our domain knowledge?
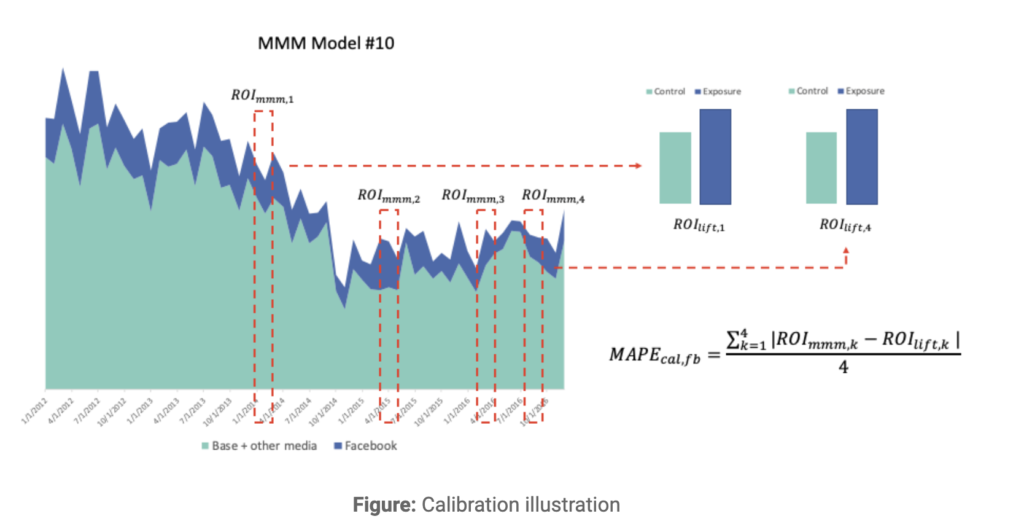
Yes, actually it is possible to calibrate Robyn with the impact of your incrementality experiments. When this feature is being used, it adds it as a third optimization metric MAPE.lift (the average percentage error vs your calibration data) alongside NRMSE and Decomp.RSSD for Nevergrad to optimize to. It’s not taken into account by the core Ridge Regression algorithm, however.
At Recast, We use a different algorithm called Bayesian Markov Chain Monte-Carlo, which takes domain knowledge into account natively. This gives us a lot of flexibility in terms of what data and business knowledge we incorporate to arrive at the correct model. It can be as simple as defining that marketing spend can never drive negative sales, or as complex as incorporating your other attribution methods into the model as priors, so that the resulting model is consistent with what you know and you get a single source of truth you can rely on.
Can we use Robyn to understand recent performance?
This is a common question from clients of traditional marketing mix modeling, which assumes that marketing channels perform the same across all time periods (accounting for saturation). Of course this might not be the best assumption to make: unlike TV, Print or Billboard campaigns which run once or twice a year, digital channels are always on and always improving with optimization and creative testing. Therefore it might make sense to look at a more recent modeling window, but then you run into another problem: not enough data! If you have less than 3 years data it’s hard to establish seasonality, and if you have less than 10 observations (days or weeks depending on your model) per variable in the model, you risk overfitting the data, making the model unreliable.
So Facebook’s solution is to offer a modeling window, which lets you take the full length of the data to determine seasonality, but then zoom into a window you set, for example the last 3 or 6 months, in order to build the model. You can also refresh an already built model with new data, with their model refresh function, which is often used by teams who put Robyn into production to run every day.
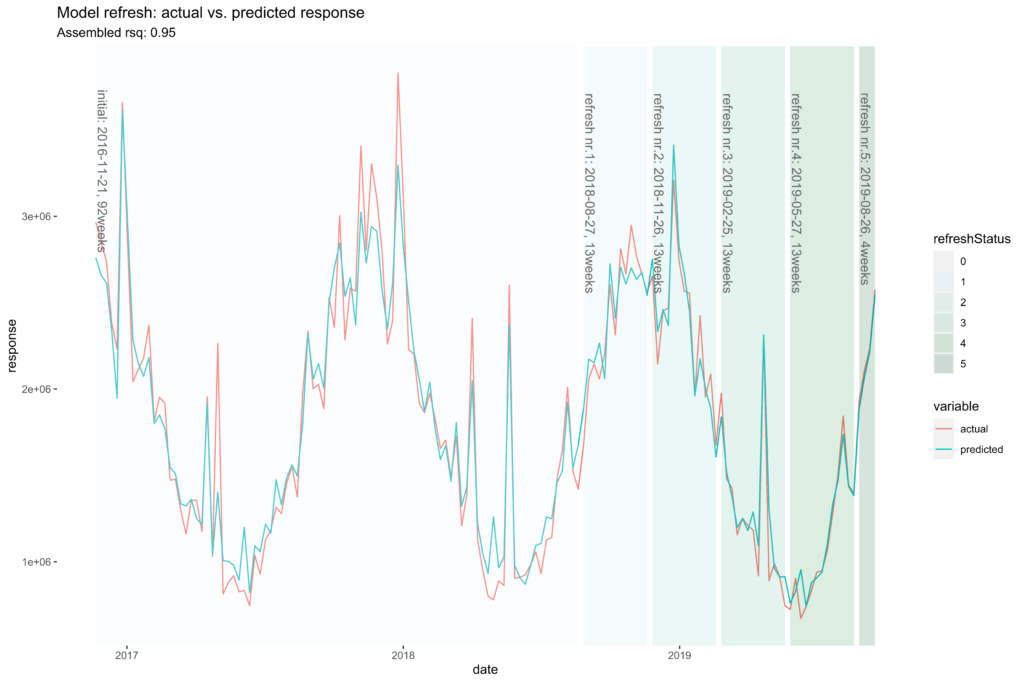
However, the shifting modeling window can be problematic for channels that have really long adstocks or shift effects (not uncommon at all in our experience) and can lead to dramatic parameter shifts as the modeling window moves around. Be careful here!
Our solution at Recast is to use the flexibility of Bayesian MMM to let marketing performance be different every day. This is only possible because we can inherit the past performance of a channel in that daily model (today is likely to be similar to yesterday) via Bayesian priors, otherwise the parameters would become unstable.
What recommendations can Robyn give me to help with decision making?
Robyn has the standard output you’d expect from a marketing mix model. There is a one pager with the most important plots, as well as several spreadsheets showing the results of the models they tested on your behalf. They offer the following features:
- Model coefficients (what impact the channel had on sales?)
- Response curves (when does the channel hit diminishing returns?)
- Adstock rates (what is the lagged effect of each channel?)
- Seasonality decomposition (when is demand high/low?)
- Share of Spend vs Effect (where am I over/under spending?)
- Fitted vs Residual (how wrong was the model)
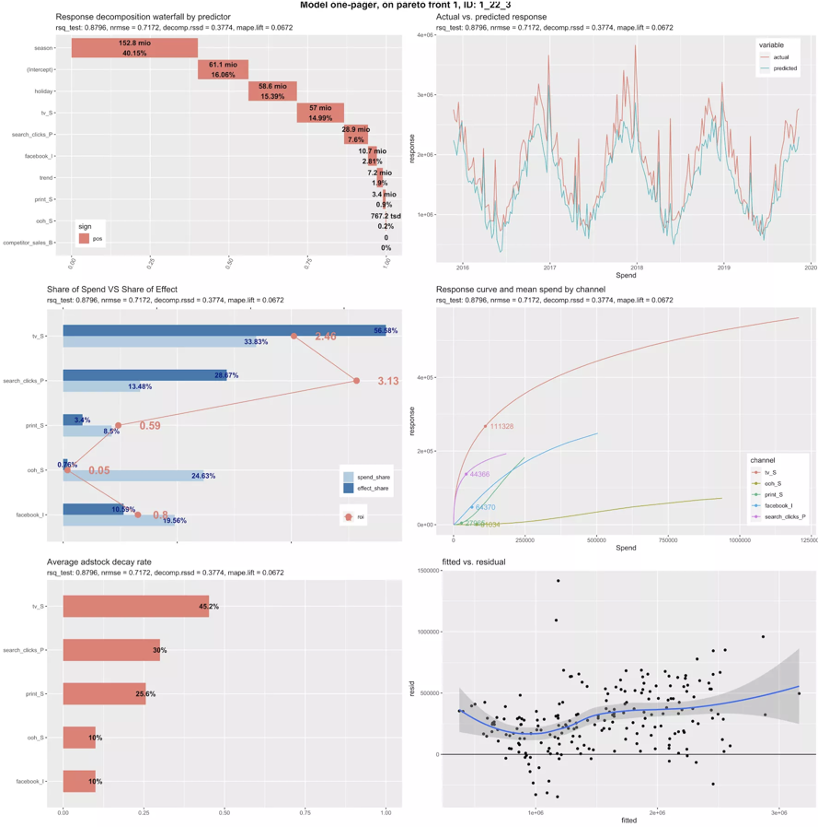
They also offer a budget optimization function, which lets you take the model parameters and forecast what your performance would be if you reallocated spend according to their estimations. All of this is fairly standard with any MMM vendor (even the ones that do it in Excel), though they did do a very good job with making the one-pager clean and actionable at a glance. In Recast we have these various components available in a dashboard, for our clients to look at, updated daily. Of course it is possible to put Robyn in production and build your own dashboard. As their code is open source this can be a good solution if you have extra data science and engineering resources, and can consult with an Econometrician to interpret the results.