In the context of marketing measurement, marketing analysts and marketing scientists use the term “incrementality” to refer to causality.
Incrementality is about measuring what actions would not have happened without a specific marketing intervention. For example if I spend money advertising my product, I need to know how many people bought my product because of the ad (not just the total number of people who purchased after seeing an ad).
When someone visits a website and buys something, advertising platforms identify that person and look in their databases to check if they previously saw an ad. If so, they report a conversion event, crediting the ad the user saw or clicked on. That’s marketing attribution. But as marketers, we need to differentiate between attribution and incrementality so that we can understand how purchases were actually caused by the advertising.
Let’s say I spend $10,000 on Facebook ads, and they report that people who saw or clicked on those ads went on to buy $25,000 worth of products. If my profit margin is 60%, I just made $5,000 return on a $10,000 investment, ROI = ($25,000 * 0.6) / $10,000 = 1.5x.
However, counting all the people who bought after being advertised to, is not the same thing as counting only the people who bought because of the ad. Correlation is not causation. Some of the people who saw my ad would have bought anyway, had I not run my campaign.
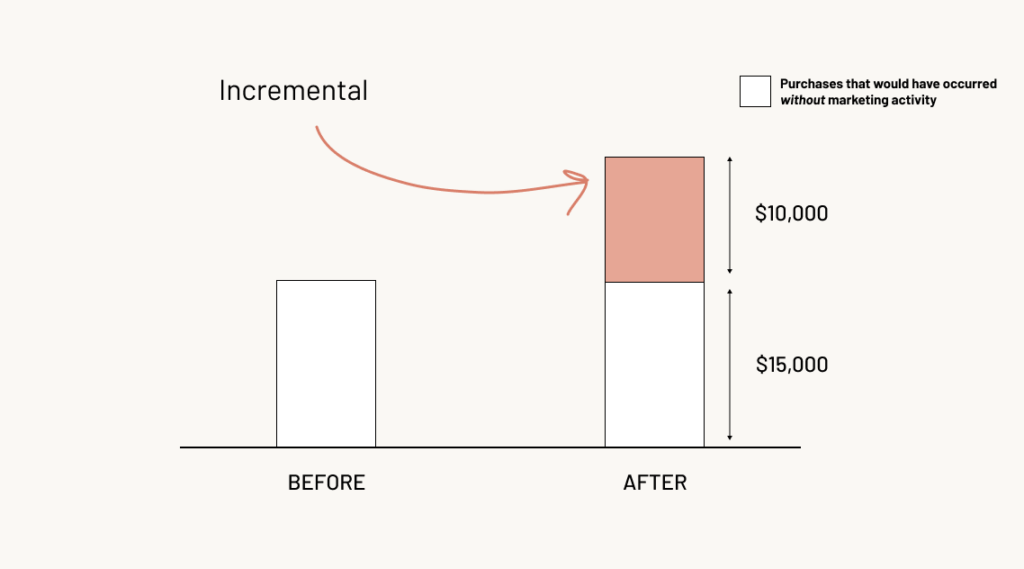
It’s an extremely important distinction. If half of the people who purchased would have done so without seeing an ad campaign, suddenly the numbers no longer work out. The campaign goes from a money earner to a loss maker.
If $15,000 worth of sales would have happened anyway, it works out that instead of making $5,000, the ad campaign lost $4,000! If we only made an incremental $10,000 in sales, with a 60% profit margin that nets out to $6,000 return, less than the initial $10,000 investment, ROI = (10,000 * 0.6) / 10,000 = 0.6.
In the beginning of a company’s life, attribution and incrementality are (often) the same thing. If nobody knows about your product, and you run an advertising campaign, you can be sure to credit the spike in sales you get back to advertising. In this stage everything that works makes an obvious incremental difference.
However as a company matures, its marketing mix gets more complex. People hear about the product from friends, not just via advertising. They get press coverage, establish a greater physical presence, and expand into less measurable advertising channels like influencers or TV.
Now it’s no longer a simple exercise to tease out what the impact of a specific ad campaign was separate from everything else. There are too many conflicting variables that drive behavior to account for. If you have a well known brand, do a lot of retargeting ads, or get a lot of sales through affiliates, it’s likely that many of your reported sales aren’t incremental.
Crucially there’s no analytics software or tracking pixel that can measure every interaction and touchpoint that led to a purchase. We can’t track word of mouth, identify who saw a billboard, or measure which influencer convinced them to buy.
Thankfully, we have an elegant solution. Randomized controlled experiments. The strategy is simple: we split our target audience into two groups, and only show the ad to one of the groups. That way, we know any difference in purchases between the two groups was down to the ad.
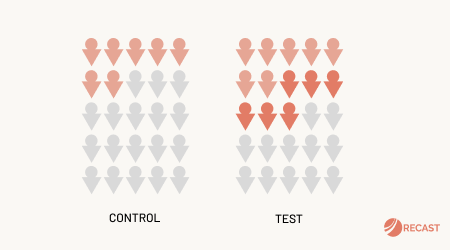
Because both groups were exposed to the same conditions, and randomly assigned to see the ad (or not), we can control for all of the other factors affecting sales, without even having to know what they are. Both the control and test will have conversions, but (hopefully) the test group will have more: the incremental conversions. Randomized controlled trials (RCTs) like this are the gold standard of proving one thing causes another.
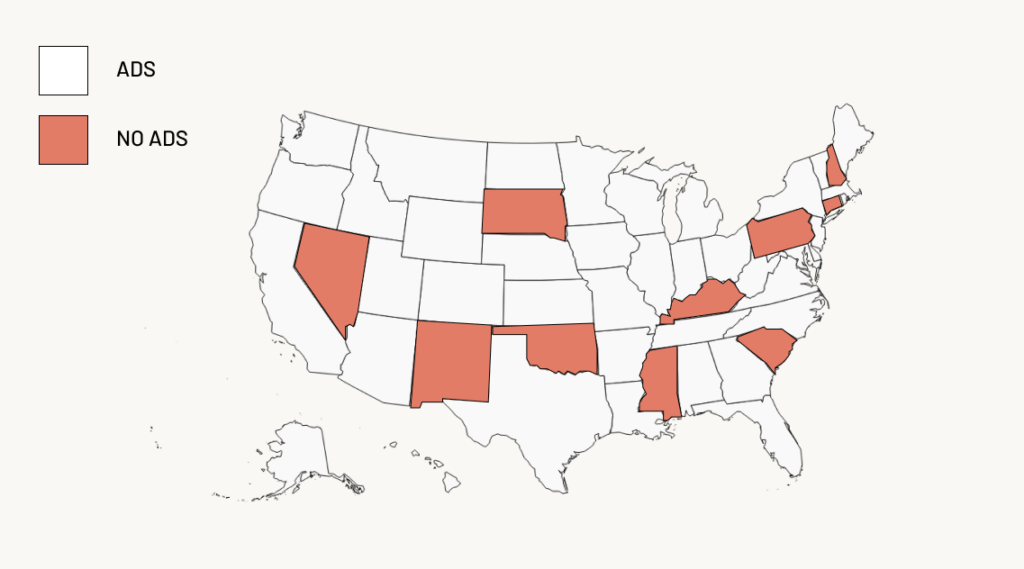
In advertising, many platforms offer incrementality testing functionality, where they handle the randomization and reporting of the experiment. You can also run your own experiments by doing geo-holdout tests using open-source libraries like GeoLift (from Meta) and CausalImpact (from Google). The idea is simple: assign a share of well matched U.S. States to a control group which doesn’t get advertising, and compare results.
In some channels there’s no real way to run a true incrementality experiment. For example, you can’t control who sees an influencer’s posts, downloads a podcast, or sees a linear TV ad (for creative bought nationally).
Even when running an experiment is possible, it’s not always feasible. Experiments come at a real cost to set up and maintain. Not just your team’s time and attention, but also the opportunity cost of turning off marketing for a proportion of your audience. Whatever share of the audience didn’t get to see your marketing, will buy less than the people who did.
Given you can’t run experiments for political or economic reasons, modeling is the preferred solution. Causal inference models are growing in popularity due to a recent Nobel Prize. In some scenarios it’s possible to simulate the conditions of an experiment, using a regression discontinuity, instrumental variable or natural experiment.
However the most popular and practical method in regular use since the 1960s is Marketing Mix Modeling (MMM). Matching spikes and dips in sales to events and actions in marketing, MMM can provide an estimate of the incrementality of each channel. Using modern Bayesian MMM it’s possible to calibrate the accuracy of a model based on the results of incrementality tests.

Marketing attribution is a complex topic, and the question of establishing incrementality isn’t going to be a solved problem in our lifetime. No experiment or model is perfect, but it’s possible to significantly reduce our uncertainty when making budget decisions, using these methods. The goal isn’t a perfect distribution of credit across each campaign, you just have to be less wrong than the competition about what’s working.
