
At Recast, we generally believe that most brands should be running more experiments, including geographic lift tests. However, we think it’s important that marketers and analysts understand the limitations of these types of experiments so they know what they can be used for as well as what they can’t.
In this article we’ll give a brief overview of what GeoLift experiments are, how they can be used to measure incrementality, and then finally, we’ll discuss some important limitations that you should be aware of.
Ever since Apple gave users the right to turn off tracking in their iOS14 update, marketers have been scrambling for a measurement solution. In our Reforge piece on “The Attribution Stack”, we wrote in depth about all of the methods you can use to evaluate the effectiveness of your ad dollars, and we think it’s a good thing that marketers are taking a more holistic approach to attribution.
One method often paired with Marketing Mix Modeling (MMM) as the solution to the ‘iOS14 problem’ is GeoLift tests, AKA geographic-level experimentation. It’s an incredibly intuitive approach that works across a wide variety of channels. It’s also appealing because it’s privacy friendly and platform independent, using only aggregated data (just like MMM), so it’s robust to whatever happens to digital tracking and privacy legislation in the future.
It works like this:
- Select a subset of the regions you would normally advertise in
- Turn advertising off in those regions for a period of time
- Measure the difference in sales in the control vs test regions
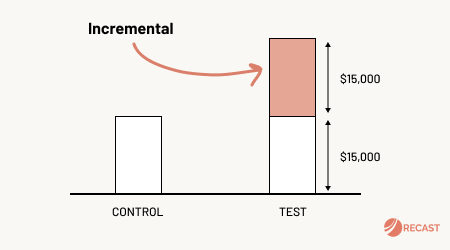
There’s more to it than that: you have to be careful with how you define regions, what regions you select, and how long you run the test (more on that later). However, this is the sort of thing any executive can understand and trust. If sales were 50% higher in regions A, B, & C (the test group with ads) than regions D, E, & F (the control group with no ads), and everything else stayed the same, then advertising must have driven those incremental sales.
The emerging best practice is to combine MMM with geo-testing, so that the results of your experiments are used to calibrate your model.
Geo-testing has been in use for decades, and is essential for testing some channels like billboards, where there’s no easy way to track which people saw the ad in order to do an individual-level randomized controlled trial.
The problem historically was that setting up an experiment of this scale required a significant amount of work. You had to take care to design an empirically valid test, set up your campaigns in a way that was targeted by geo region, and then wait for 3 to 5 weeks to collect enough data (as a clean 4 to 8 week pretest period for comparison). This is too slow for all but the most important strategic decisions.
With only a limited number of ways to break the country into geo-regions, you also can’t get very granular with your results. Geo-testing may be fantastic at telling you whether your TV campaign drove sales, but you can’t expect to use it to split test 100 different ad variations. As a result, geo-testing has claimed the high ground of testing the incrementality of individual channels (or teasing out interactions between channels), but it generally can’t be used for determining what works on a tactical level. You can of course break each country into smaller and smaller regions, for example at the DMA or zip code level, but that can bring its own problems depending on the amount of noise in the data and the operational overhead of managing so many different geographies.
GeoLift experiments are often costly since they’re both complex and broad. Data scientists are expensive, and you often need them to set up the test and interpret the results. Additionally, there’s often a lot of manual overhead to actually running the test (you have to buy media in all of the different geographies!). Finally, there’s the actual cost of running the test itself: turning off an ad channel for several weeks means you lose sales in those regions you otherwise would have made. Good luck making your quarter!
Common Issues with Geo-testing
GeoLift experimentation has more limitations than many people realize. They are experiments and therefore get a favorable comparison to A/B Testing, or Randomized Controlled Trials, which is the gold standard in the hierarchy of evidence. People know about “double blind” experiments from the field of medicine, and are usually aware that randomized control and test groups are the only way to truly establish causality.
However, it’s important to realize that GeoLift experiments are generally more limited than individual-level experiments like an A/B test you run on your website. It could be called GeoLift modeling instead of GeoLift experimentation! There is a ‘treatment’, but individuals are not being split cleanly into buckets: you can’t guarantee that the treatment (spending money on advertising) only had an effect in your Test regions, or that your results would be the same if you scaled the campaigns nationally. There have been advances in GeoLift experimentation in recent years, but they’re advances in modeling: for example Meta’s GeoLift library uses an “augmented synthetic control” method to design and analyze experiments.
These are valid techniques, and they are the closest thing you can get to a real randomized controlled test for some channels. Causal Inference techniques such as those used for doing GeoLift experiments even won the Nobel Prize in recent years: they’re powerful tools that are being applied by scientists across many disciplines, not just marketing. These techniques certainly sit higher in the hierarchy of evidence than most others, but they’re not foolproof.
In the following sections we’ll explore a few of these limitations.
Cross-Group Contamination
People don’t stay in one place. At any given time a significant number of people who see your advertising are on vacation, or traveling for work, visiting family, or any number of reasons to be away from home. In some geographies this is endemic. For example, say you were running a job promotion campaign in New Jersey: where many thousands of people commute across the bridges and tunnels to New York City. If the State of New York was in your Control group and New Jersey was in your Test group, you’d have a real problem. Someone driving past your billboard in New Jersey, might search for your brand when they get into work in NYC. Instead, the campaign should be run in the entire New York metropolitan area, which would decrease the effect of movement across borders, but it will never be perfect.
In this digital age can we really guarantee that our advertising messages will be seen only by the people in the region we target? If I live in England and I tell my friend in New York about a new brand of shoes I like, we’ve cross-contaminated any potential GeoLift experiment that was running between the two countries. Quite often ad campaigns go viral, as they are usually posted to video platforms like YouTube and TikTok, and shared organically from there. That’s great for the performance of your campaign, but muddies the water for measuring the incrementality of your performance.
Targeting & Placement
In many channels, the performance profile of local geographic campaigns will be different than they would be at the national level. For example when you buy TV placements regionally you’re often buying different networks than you would nationally! If you’re buying an ad that airs on the local news affiliate in 25 of the 50 states, you’re testing how well TV works on those local channels. When you scale the campaign up nationally and advertise on CNN, you are bound to get very different results. To muddy the water further, the distribution of people who watch local TV is non homogenous: meaning in some Geo Regions like New York City, more people might watch national TV channels, or stream on demand, rather than watch local channels live. Even if you’re buying the same placements locally, often those placements are more expensive to buy on a CPM basis than national television.
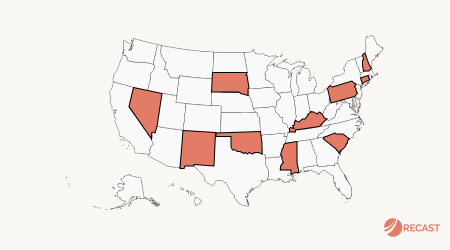
Even for the channels that support it, geo-targeting capability and restrictions vary across countries. Some channels support State / Province level only, others allow you to drill down to the DMA or even Zip / Postal code. Some countries like Japan don’t have street addresses like you may be used to if you live in North America or Europe! The country of France only has 12 provinces or regions (and 1 territorial collectivity, Corsica), and therefore getting enough statistical power for your GeoLift experiment can be tricky.
Even when you do geo splits within a channel, it’s still not a clean test: you’re typically inflating the cost of your ads compared to running a broad audience for the whole country! This is because Facebook, Instagram, TikTok, or whatever channel you’re advertising on, now has less data to work with for each individual campaign. Where before, they could move the budget freely to match whatever opportunity came up, they now are forced to throw good money after bad simply because that region is part of the test.
Structural Limitations
While geo-testing is reasonably well supported across most major ad channels, it’s often structurally impossible in the most important organic channels. For example you can’t delist your website from Google just in California, so it’s impossible to get a sense of how many incremental sales your investment in SEO for Google drives. You could of course delist your entire website, like Groupon famously did in a bold experiment, but good luck getting that past your manager. Even then it can’t give you much granularity, for example you couldn’t easily split out your blog from your product pages to test whether your investment in building links for blog posts has paid off (you have no guarantee Google will respect your robots.txt).
Another example of a structural challenge is the Podcasting space. Of course when people download podcasts, you could track their IP address, but there’s no way to ‘switch off’ the download button in Spotify for specific regions. You also have no control over when or where people listen to them once they’re downloaded on their phone. Many podcasts also syndicate over to YouTube, making analysis even harder, and to make matters worse fans often take clips of popular podcasts and post them on social media channels like TikTok. There’s just no way to untangle that mess.
Nobody controls the 24 hour news cycle, not even the news reporters themselves. If something important is happening, all relevant news outlets must report it, or risk losing the audience. So once your news story is out in the world, you have essentially no control over it. Sure you could pitch just to local news outlets, but they’re often syndicates of national chains, or act as sources for national reporters with wider distribution. As well as inconsistency across geos, PR also suffers from inconsistency in campaign results: a great story pitched on the wrong day might fade away quickly, whereas a weak story on a slow news day might be widely reported. Nobody knows what kind of day it’s going to be until it happens: that’s why it’s called ‘news’!
Saturation
One common but often under-appreciated aspect of running GeoLift experiments is that it’s very easy to accidentally over-saturate the market as part of the test. Here’s an example that we’ve seen before:
- You run advertising on the radio nationally.
- You want to run a geo-level test without turning off your national campaign.
- You spend a ton of money into certain geographies to measure lift from that additional radio.
- Within those geographies, users are hearing your ads constantly: you’re on nationally syndicated shows as well as local shows. You’re saturating the airwaves.
- Your test analysis tells you that the additional radio spend in those geographies wasn’t very effective.
The issue here should be obvious: with the additional spend you put into each of the geographies, you over-saturated the market with your advertising. Ideally, when you run a GeoLift experiment you’re delivering the ads with the same reach and frequency as you would nationally. This is unfortunately really hard to do – over-spending on a per-audience-member basis is really easy to do, especially if your power analysis (see below) doesn’t take into account the problem of saturation.
What we’ve found is that for some channels it’s impossible to design a GeoLift experiment that has sufficient power. This is because the channel’s saturation point is low enough that even if the channel is very effective at current levels of spend, that level of spend (per geo) isn’t sufficient to drive signal to consistently avoid false negatives. However, increasing spend would cause the channel to saturate and so there’s no way for them to get enough signal with that channel.
Delayed Effects
Your experiment has been running for several weeks now, and you can’t wait for it to finish so you can declare a winner and move onto the next test. Not so fast. Marketing campaigns don’t exert their entire effect on the day the marketing activity happens. Some channels like TV or online video still have an incremental impact days or weeks after the campaign finished running, sometimes called the ‘adstock’ or ‘time shift’. If you stop your test too early, and don’t include a ‘cool down’ period in your analysis, you risk throwing out this causal effect, seriously undervaluing the return on investment you get from upper funnel channels.
It’s also important to note that this effect can happen at the start of the test as well – your treatment geographies could be being impacted by marketing that went live prior to the experiment and is “bleeding over” into the test period.
This of course means tests take even longer than the typical 4 to 8 week pre test + 3 to 5 week test periods, limiting their application to only long term, strategically important decisions. It’s not just the delayed effect of the test you have to account for, but the value of information over time. If an experiment takes 3 months to run, it likely won’t be practical to run every quarter, especially when you have other experiments you want to try. That means you could be trading on old information for several years, before you get a chance to test again. With the rate of change and innovation in modern marketing, what might have been true only a few months ago might already be out of date by the time you get your test results.
Outliers & Missing Variables
One particular problem that always comes up with geo-testing is when a shock occurs – an unexpected spike or dip – either for a known or unknown reason. For example if there’s adverse weather in one part of the country, that can affect the control and treatment groups differently, which can bias the results of the test. Of course the longer you need to run your geo-test, the more likely you are to encounter this type of outlier event. Sometimes there’s a spike in the data that we can’t explain, because we rarely have all of the information we’d like about what’s driving sales. For example many national retailers don’t even know which of their stores are running promotions at any given time, and that sort of difference in geographies could distort the results.
In the event of an outlier it’s important to investigate what could have caused it, because if you know the variable you’re missing you could account for it in the analysis, or make a judgment call on its relative importance. Where root causes can’t be established for whatever reason, you can account for outliers through a ‘leave-one-out’ analysis: repeat the analysis as many times as there are geo regions, each time dropping one geo from the analysis, then look at a histogram of the estimates to see which geos have a clear effect on the analysis.
Location Data
How do you split users by their location in the first place? Primarily the IP address is used, but it turns out this isn’t that reliable an indicator of what region to bucket someone in. Actual IP address accuracy is as high as 95 percent to 99 percent accuracy of a user’s country. However, geolocation services only provide 55 percent to 80 percent accuracy for identifying a user’s region or state, and 50 percent to 75 percent accuracy for a user’s city. In practice, the actual accuracy may vary from provider to provider and depending on the location of the device.
There’s a growing consumer backlash against ‘surveillance capitalism’: the idea that companies are invading your privacy and selling your data to the highest bidder. It is estimated that 31% of internet users have used a VPN, which hides your true IP address. Governments are starting to legislate against tracking user’s locations, for example the EU considers IP addresses as personal data, protected under the GDPR. In addition Apple’s privacy moves haven’t been limited to the fallout from iOS14: for example Private Relay masks your IP address and the email app blocks tracking pixels from loading (which is how email service providers track location).
Things to Consider When Designing a Geo-test
In the previous section we discussed some common issues that people run into when doing GeoLift experiments. In this section we’ll cover some important strategies to use when designing your own GeoLift experiments.
Matched Markets
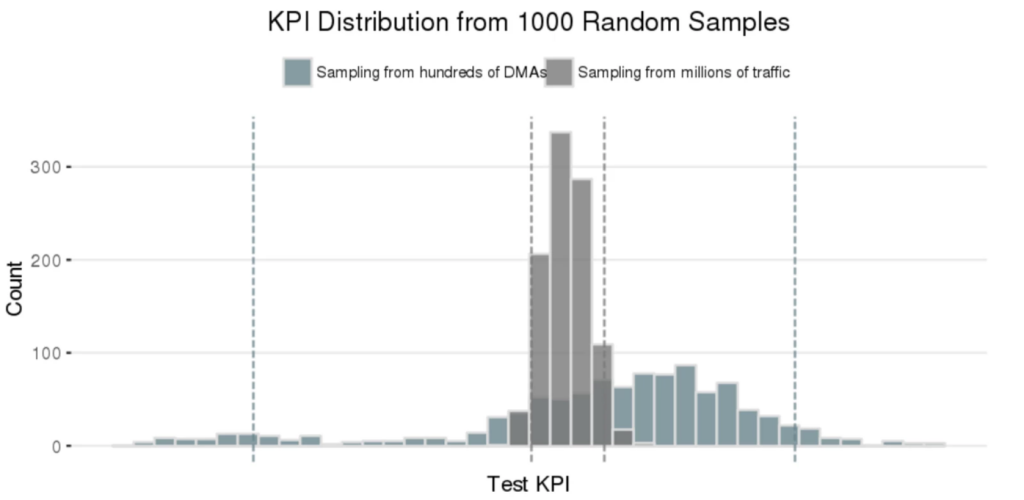
You might think it’s as simple as randomly assigning geo regions to test and control groups, and measuring the differences, and that is a common approach, but there’s a problem. Different geographic regions have different properties, and if too many of one type of region randomly fall into the same group, you could be biasing your results. For example New York, Texas, and California are amongst the largest and wealthiest states – they have economies big enough to be their own countries – so if all three end up in your Test group, the performance of the group will be heavily affected by what goes on there. As a result splitting by geo region tends to have more variance and bias than splitting by traffic, as demonstrated by Wayfair below:
Thankfully statistical approaches like Stratified Sampling and Market Matching have been developed that can automatically select more valid matches in terms of regions based on your data, so for example similar sized states are split to be more equal across groups and there are no differences in performance pre-test. Papers out of the University of Texas and Journal of Economic Literature, among others, have advanced our ability to select synthetic controls. In addition Google and Meta’s open-source libraries have made doing a proper statistical analysis more accessible to the average marketing team. However this requires knowing random assignment is a trap in the first place, and having someone technical on your team who can run and understand the results of these libraries.
Power Analysis
As with any experiment, it is essential that a GeoLift experiment is designed to have a high probability of being successful (yielding statistically meaningful, or statistically significant results). Before we run the test, we need to estimate the power of the experiment: the probability of detecting an effect if there really is truly an effect of a certain magnitude. Of course, we can’t know what the effect of our advertising is before we run the test, that’s why we’re running it! So instead the question we tend to ask is something more like “assuming there’s a 20% incremental impact from ads, how long should I run this experiment to prove that?”.
The power of an experiment is a tradeoff between effect size, number of geos, and run time. More data lets you fine tune your experiment to detect smaller effects. Some countries like the U.S. have plenty of well defined geo regions, for example 50 states, 210 DMAs, and 41,683 zip codes. However other countries don’t have clearly defined geo regions, or even postal codes, so a cluster analysis must be done to synthesize these regions: potentially introducing another source of bias.

An example of using a clustering algorithm to generate unofficial geo regions in France, a country with a limited number of official regions. Source.
For a given country, with a fixed number of geo regions, at some point the effect size will be too small to be worth running the experiment, because the time taken or ad spend needed are impractical, and you have a backlog of important things to test. In these cases you can run a shorter test to look for a larger effect size, then move on if you don’t find it, risking a false negative (recording a negative result, when in truth there was a positive effect that was too small to detect with your test).
The expected precision of our test can be computed by simulating possible experimental outcomes. We also check that the false positive rate (i.e. the probability of obtaining a statistically significant result if the true ROI is zero) is within an acceptable range (5% – 10%). This power analysis is absolutely essential in the design phase because it tells us how much we need to spend on ads and over what time period in order to have a valid test. In practice though there are budget limitations to consider, the effect of diminishing returns (higher spend hurts efficiency as all the low hanging fruit is taken), as well as structural reasons we might not be able to spend more money to reach significance.
Conclusion
In this article we’ve talked a lot about some of the limitations of GeoLift experiments in marketing. Just to be clear: we think GeoLift experiments are great and your brand should probably be doing more of them.
However, we also think it’s important to recognize that there are no silver bullets when it comes to marketing measurement. GeoLift experiments, like every other strategy for measuring marketing effectiveness, have important limitations.
When you use multiple marketing measurement methods they will no doubt disagree, and that’s a good thing! The differences between them present an opportunity to investigate further and learn something about your users. As you do the hard work to figure out marketing measurement, you’ll come out the other side with an unfair advantage your competitors can’t easily replicate. These methods are complicated and confusing, but smart vendors, open source libraries, and blog posts from experts in the field are making things easier and more accessible every day.