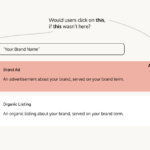
Any metric that doesn’t have a strong causal link with sales outcomes is a vanity metric. For example while Clickthrough Rate (CTR) is often correlated with conversions (you can’t convert unless you’ve clicked on an ad), there are scenarios where ads with lower CTRs actually have better Conversion Rates (CVR). This makes CTR a vanity metric, while cost per conversion is the actionable metric you should truly care about.
An actionable metric isn’t just correlated with meaningful business results, it drives them.
A real-life example from Measured shows that Campaign A with a higher Clickthrough Rate (CTR) of 0.37% than Campaign B’s lower CTR of 0.25% performed poorly when it comes to the metric that actually matters — Cost Per Order, or how much an organization spent on average to acquire an order. The company spent $5.11 less per order in Campaign B than in Campaign A.
Even with a lower CTR, Campaign B outperformed Campaign A at the meaningful bottom-of-the-funnel metric because it had a higher conversion rate (CVR) at 32% than Campaign A’s CVR of 25%.
| Campaign A | Campaign B | |
|---|---|---|
| Clickthrough Rate (CTR) | 0.37% | 0.25% |
| Conversion Rate (CVR) | 25% | 32% |
| Cost Per Order | $41.28 | $36.17 |
Actionable metrics measure quality metrics, as it relates to business results. For example, traffic that converts, high-intent leads, returning customers, engaged users, engaged followers who are more likely to buy, etc.
Here are some of the common vanity metrics and the meaningful metrics to use instead:
1. CTR vs CAC
When running paid ads, there are various available metrics such as impressions, clicks, click-through rate (CTR), conversion rate, and others.
Especially if you run ads on social channels, the channel’s ad managers would highlight metrics like clicks and CTR because we usually pay for each click on these platforms. CTR is the number of clicks that your ad receives divided by the number of times your ad is shown.
High CTR implies that the ad copy, image, and CTA are compelling people to click and see the offer. However, it doesn’t indicate how many people are actually converting when they land on the offer page on your website. As in the case of Campaign A vs B by Measured, discussed above.
Having an actionable metric like Customer Acquisition Cost (CAC, or how much an organization spends to acquire new customers) would mean we would optimise for things like making the landing page load faster, improving the conversion rate on the offer page, aiming to convert more people who are clicking instead of just getting more clicks and traffic.
“Campaign B was optimized to Cost Per Order, which is the true goal of the business. Despite being worse on every other metric, it ultimately drove orders for 12.4% cheaper, which is typically what we care about most as a business,” wrote Nick Stoltz about the experiment.
2. MQLs vs MQLs worth $X
As a marketer, you would know that not all MQLs (marketing qualified leads) are equal. For example, a person who requests a demo may be more likely to buy than when he is downloading an ebook. But PDF requests can be easier to generate than demo requests. So, if your goal is to achieve 1,000 MQLs, and both ebook downloads and demo requests are measured as MQLs, chances are you would promote the CTA (call to action) for ebook downloads over demo requests to meet your KPI (key performing indicator).
Now when those lower intent MQLs are passed over to sales, the conversion rate from lead to sales would be low, making it less likely for the sales team to meet their targets.
HubSpot experienced this misalignment between sales and marketing when the marketing team changed all CTAs to ebook downloads to meet their KPIs.
To address this issue (video from 1:57 minute), they measured the conversion rate from the two lead segments and discovered that 1% of book leads converted to customers that purchased $1,000, while 3% of demo requests converted to customers buying $1,000 each. Based on this data, they determined that a demo request was worth $3,000, and an ebook request was worth $1,000.
As a result, they changed the marketing team’s KPI from “generate 1000 MQLs” to “generate $300,000 of lead value”, putting them on a revenue quota like the sales team, explains Mark Roberge, former founding member of HubSpot’s sales team and now a senior lecturer at Harvard Business School. Now it didn’t matter whether the marketing team got there via 1000 demo requests or 3000 ebook downloads.
Hence, simply collecting information and sending it to sales could be a vanity metric if the leads are not suitable for conversion. Therefore, it is crucial to segment leads based on high or low intent or a specific dollar value to ensure that the information provided to sales is of high quality.
3. Traffic vs conversions
For organic or social channels, measuring traffic is a vanity metric. For example, in the below image, traffic from Facebook (45,379) is much more than traffic from SlideShare (14,805). But the conversion rate from Facebook is only 0.24%, leading to $7,580 worth of value, versus the conversion rate from SlideShare is 1.01%, leading to more dollar value at $7,620, even with 3 times less traffic.
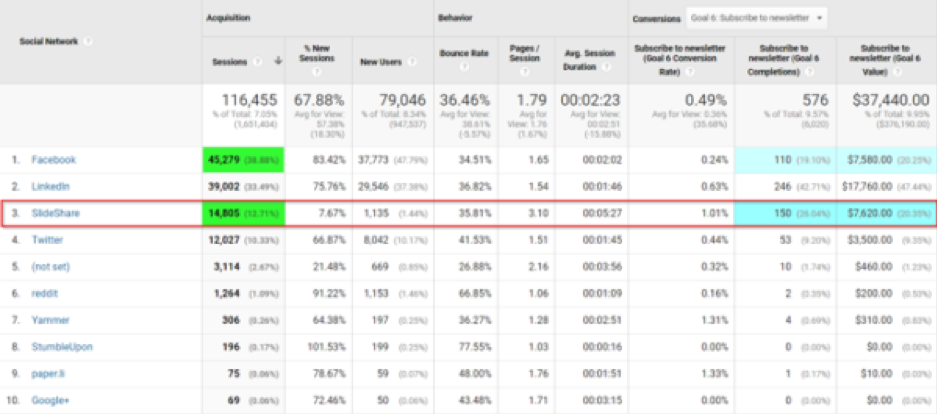
As Daniel Hochuli writes in a Content Marketing Institute blog post, “There is no point in counting traffic unless it’s paired against a business objective. Yes, you need traffic to convert; but more traffic does not always equal more conversions.”
Hence in the above example, Slideshare is more successful than Facebook in driving conversions.
4. Total customers vs CLV
In 2016, Microsoft abandoned a common vanity metric of total hardware sales of Xbox One because it was a vanity metric. “If I sold a console two years ago and now it’s in a closet collecting dust, that’s not good for the gamer, that’s not good for the developers, and frankly, it’s not good for Microsoft,” Microsoft’s Phil Spencer said. The total sales number would always go up and won’t be a real “reflection of how healthy your ecosystem is”, he said.
They instead replaced it with Monthly Active Users (MAU), because “we want to gauge our success on how happy and engaged those customers are,” said Spencer. “We focus on the monthly active user base because we know those are [people] making a conscious choice to pick our content, our games, our platform, our service.”
Driving MAU to be high also ensures that people are more likely to use the recurring subscription-based service, hence increasing their Customer Lifetime Value (CLV). CLV is the average revenue you can generate from customers over the entire lifetime of their account.
Other meaningful alternatives for total sales could be a percentage increase in new customers month over month. This, along with an increase in CLV would be a truer measure of a healthy ecosystem.
5. Free trial downloads vs conversion rate
Similar to total hardware sales, total downloads of a freemium version of apps or software could be a vanity metric. The total number of trial downloads is a number that always goes up. Even a percentage increase in free downloads month-over-month is a vanity metric unless clubbed with other metrics to assess the quality of those new users.
Are those trial users engaged and likely to convert to paid? A KPI of conversion rate (percentage of total downloads that converted to paid users) is an actionable metric.
Similarly, how long do those new paid users continue to be customers? Instead of total new users, the retention rate is a meaningful metric. Retention rate is the percentage of customers who continue paying for a product over a given timeframe. A high retention rate leads to higher CLV, which is good for a business.
6. Social media followers vs engagement rate
Social media is a top-of-the-funnel channel mainly used for brand awareness and community building. Any social metrics are usually considered vanity metrics because they are too top of the funnel to measure their impact on sales.
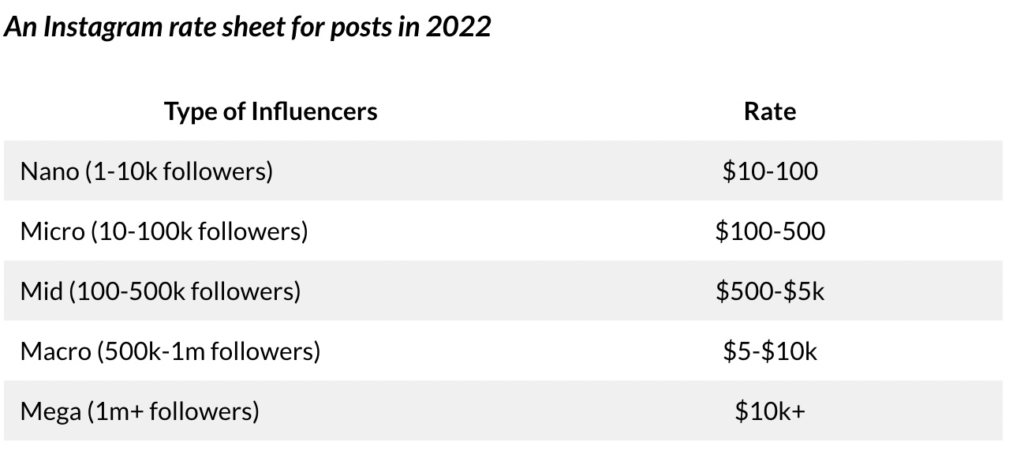
However, companies spend a lot of money on influencer marketing, where they pay influencers to promote their brand or product on social channels. The pay for the posts is dependent on the influencer’s follower count. It shows that social media follower count is not entirely a vanity metric and can impact sales.
So, companies invest in building followers on their own social channels, which can be used as marketing channels for their own promotions and launches. However, a social media manager can increase your company’s follower count by spammy cross-promotions, giveaways, or even buying them. The followers gained this way would be low quality and won’t help drive much revenue.
Hence, a way to measure the quality of social media followers is by the meaningful metric of engagement rate per follower. Engaged followers are more likely to purchase from you. However, you can look at both metrics — follower count as well as engagement rate — to ensure quality growth.
Any other bottom-of-the-funnel metrics like sales from a social channel are also meaningful metrics, but an acute focus on sales from community-building channels can seem spammy as it is counterintuitive to why people visit them. In fact, a best practice is to promote less than 30% of the time on your own social channels.
Context is everything
When it comes to KPIs, context is everything. The metrics you use depend on at what level and for what purpose you are using them. For example, social media engagement rate is usually considered a vanity metric because it is not connected directly to sales, but for a social media manager, it can be an actionable metric.
Similarly, vanity metrics like CTR can be used to optimise campaigns. For example, to figure out which creative or ad copy is resonating better with your audience, you could run an A/B test and see which has a higher CTR.
However, you should always “trust but verify”. Vanity metrics can be used for short-term directional decisions but you always need something in place to check the relationship with lower funnel value, and course correct if not. For example, does your social channel have a high engagement rate and yet a low conversion rate with respect to social traffic? Maybe it means what you sell is not aligned with your social content. Does the ad that had a high CTR have a lower conversion rate than the ad with a lower CTR? It could mean that the ad copy/creative/CTA, though attractive and clickable, did not accurately represent your actual offer.
As they say, what you measure grows. Which metrics you use as your KPI will determine what you focus on. Choosing a right or wrong KPI will impact everything from your strategy and execution, to what campaigns you run and what results you get. Hence, it is crucial to ensure that your KPIs are not vanity metrics but are meaningful and drive business impact.