We’ve been seeing more and more advertising platforms promote some form of “modeled incrementality” estimates and often marketers aren’t sure exactly what that means. In this blog post we’ll lay out the different methods making the rounds and discuss some of their limitations.
The main approaches we’ve seen for “always on” or “modeled” incrementality are:
- Lift-above-baseline analysis
- Synthetic control via matching
- Machine-learning based modeling
All three need to be interpreted carefully, so let’s dive in:
Lift Above Baseline
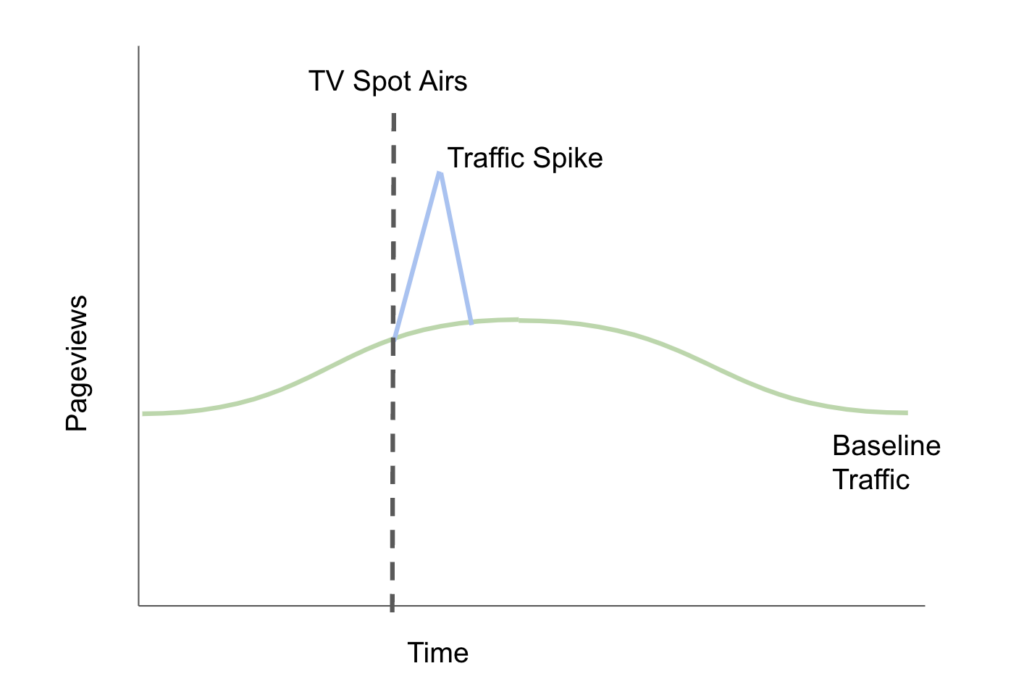
This type of analysis is commonly used to evaluate the performance of TV channels (online, streaming, and linear) and the logic is simple: identify when a spike in website traffic occurs after a TV spot airs, and then assume the users in the “spike” were driven by the TV commercial.
The idealized version of this analysis looks something like this:

Unfortunately, in the real world there are a few problems with this sort of analysis. First, it’s impossible to know which page views were driven by the commercial vs which were part of the baseline. For a heavily-traffic site where the TV commercial drives a 25% increase in page views in a “spike” it’s impossible to know which of those individual users were driven by the commercial. It may be the case that those that hopped onto the website after seeing the TV ad were just curious, but not the right target customer profile, or not in the right stage of the buying journey. They may be qualitatively different, and substantially less (or, to be fair, more — although this is unlikely) valuable visitors. Without knowing who’s who, any method of attributing conversions from the increase in pageviews is likely to overcredit the effect of the ad.
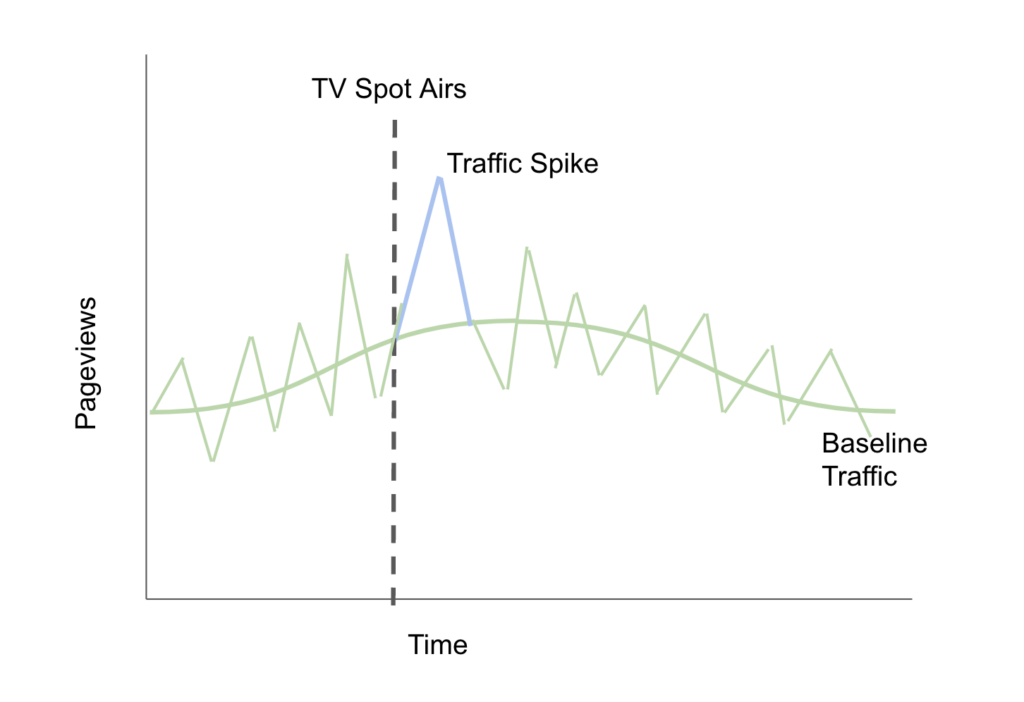
And it gets worse. Real traffic doesn’t look like the smooth line above — it’s actually spiky itself. When you put the traffic spike into context with the non-smoothed traffic numbers, it no longer looks so prominent. Maybe it drove a bit more traffic than usual, but maybe the commercial happened to come before an increase in traffic that was just part of the normal natural variation in traffic during the day:

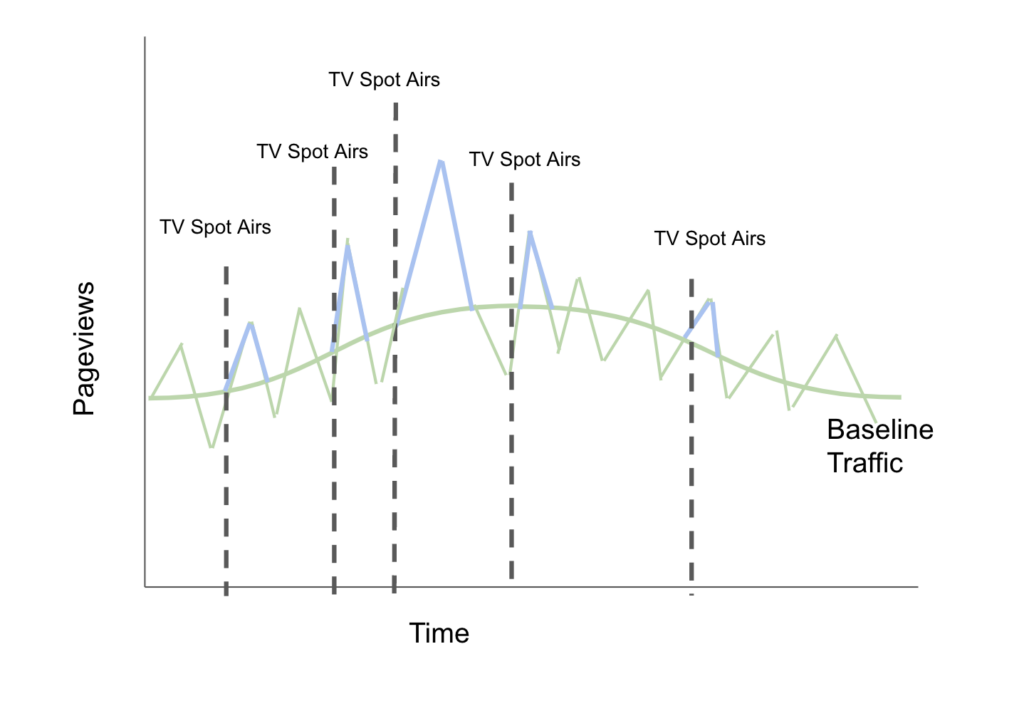
Once you start managing your TV program with this type of measurement it gets even worse, because now the vendor is incentivized to run as many ads as they can so that they’ll get credit for all of the spikes “above baseline” that were going to happen anyway. You could see something like this:

Here we can see that the TV vendor is just taking credit for the “spikes” that occur naturally. Even if the TV spots aren’t doing anything (as it appears in this case) the TV vendor is incentivized to run more and more spots so that they can take credit for more of the “traffic spikes” that are just part of the background noise.
Synthetic Control via Matching
Running true lift / incrementality tests can be expensive, so one thing some vendors will try to do is to implement a synthetic lift-test via matching. The idea is as follows:
- Look at the users we showed an ad to. This is our “treatment group”
- Look at our user base and identify other users that look similar to the treatment group. Take those similar-looking users and call them the “control group”
- If users in the treatment group convert at a higher rate than users in the control group, then we can take that as a measure of incrementality.
This makes a lot of sense in theory but it turns out that the whole analysis is entirely dependent on the quality of the match in step 2. In practice, it is very very difficult to ensure a high-quality match via observational data and in general the results of the analysis will be highly sensitive to the way the match is determined.
In a past life I did many of these sorts of analyses on behalf of pharmaceutical companies using both direct matching techniques and a technique known as “inverse propensity score weighting”. What I can tell you is that in those investigations the final results of the analyses were highly, highly dependent on exactly how the matching and weighting were done. In fact, a dishonest analyst could very easily run hundreds of different versions of the algorithm (all of which might seem reasonable!) and simply choose the version that gave the results they wanted to see.
Unfortunately, when these vendors do this sort of analysis behind-the-scenes, it’s impossible to validate their matching algorithm or to know what the results would look like if they did the matching slightly differently. Additionally, there’s an inherent conflict of interest: the vendor wants to paint their product in the best light, so it shouldn’t be surprising if the matching algorithm tends to favor their product.
While these sorts of analyses can be directionally helpful, we don’t believe that they are a replacement for a true randomized-control-trial experiment.
Machine-learning based modeling
Machine-learning based modeling practically works similarly to the matching algorithms described above in so far as the conclusions are highly dependent on the vendor’s black-box algorithm.
- Create a model that predicts a user’s likelihood of purchase based on historical behavioral data (see this blog post for an example)
- Score every user that engaged with an ad
- Predict how many users you think will purchase based on those scores
- Sum up the scores and call that your “modeled conversion” estimate
This methodology has very similar limitations to the ones discussed in the previous section on matching: the results will be incredibly sensitive to what data are included in the model and the particular way the model is configured and trained. And the platforms themselves are of course incentivized to show higher “modeled conversion” numbers so it’s important to bring a very healthy degree of skepticism to these numbers!
Conclusion
You should be very wary of any platform that 1) gets paid more the more advertising dollars you spend with them and 2) wants to grade their own homework. These sorts of “modeled conversions” or “always-on incrementality” metrics can be helpful directionally for the purposes of tactical campaign optimization (i.e. switching out poor performing ads), but because the methods are opaque they are no substitute for a true incrementality test or an unbiased statistical model (like what we have built at Recast), ideally both!


