I once ran a new PR campaign for a website that I knew did not have any previous backlinks. The next day, we received 8 times the usual website traffic from SEO. We attributed the spike in traffic to the press coverage.
What made that attribution so easy, ironically, was the lack of tracking. Logically, the increase in website traffic was due to the only promotion that happened that week. We assumed that readers saw the press mention, googled us and landed on our website.
However, most companies take Google Analytics’ tracking as the source of truth, especially for paid ads. But we can usually see a spike in key metrics from Organic and Direct corresponding to the campaign time, whether it’s a PR campaign or paid advertising.
GA is misattributing some impact of the campaigns to SEO and Direct. Channel-specific conversions are selling you short. According to CMO at Channel 99 Nani Shaffer, click-through data usually underestimates ad traffic by a factor of 3-4x.
Why campaign tracking is not accurate
There are two major reasons why a campaign impact is wrongly credited to other channels:
1. iOS14 update
Apple enhanced its privacy policy in the iOS 14.5 release in 2021. Now, any time a user downloads an app, a pop-up asks if they want to grant the app permission to track them. The pop-up appears on downloading any app in the iOS store, including Facebook and Instagram where many companies advertise. Earlier, users could change the default privacy option only manually under Settings.
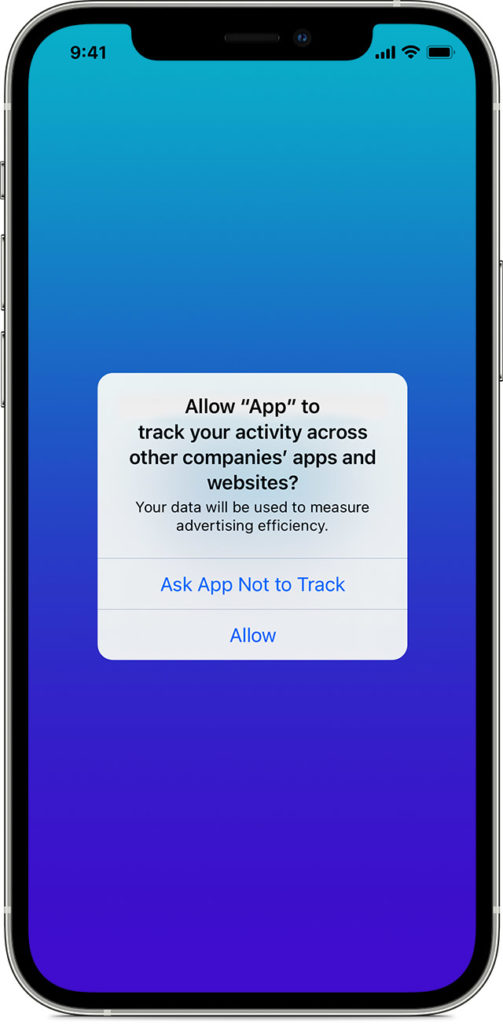
This update impacts half of all mobile users in the US, and 96% of users have opted out of being tracked. Because of this, reporting has become less accurate. Research suggests that since then, 32% of all non-organic installs are misattributed as organic.
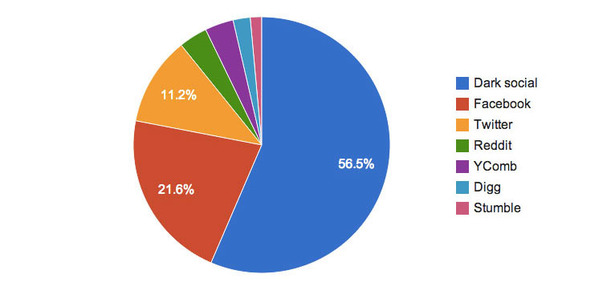
2. Dark social
Dark social refers to traffic from links shared in private channels like WhatsApp or email. Research suggests that over 80% of all sharing happens through these private channels.
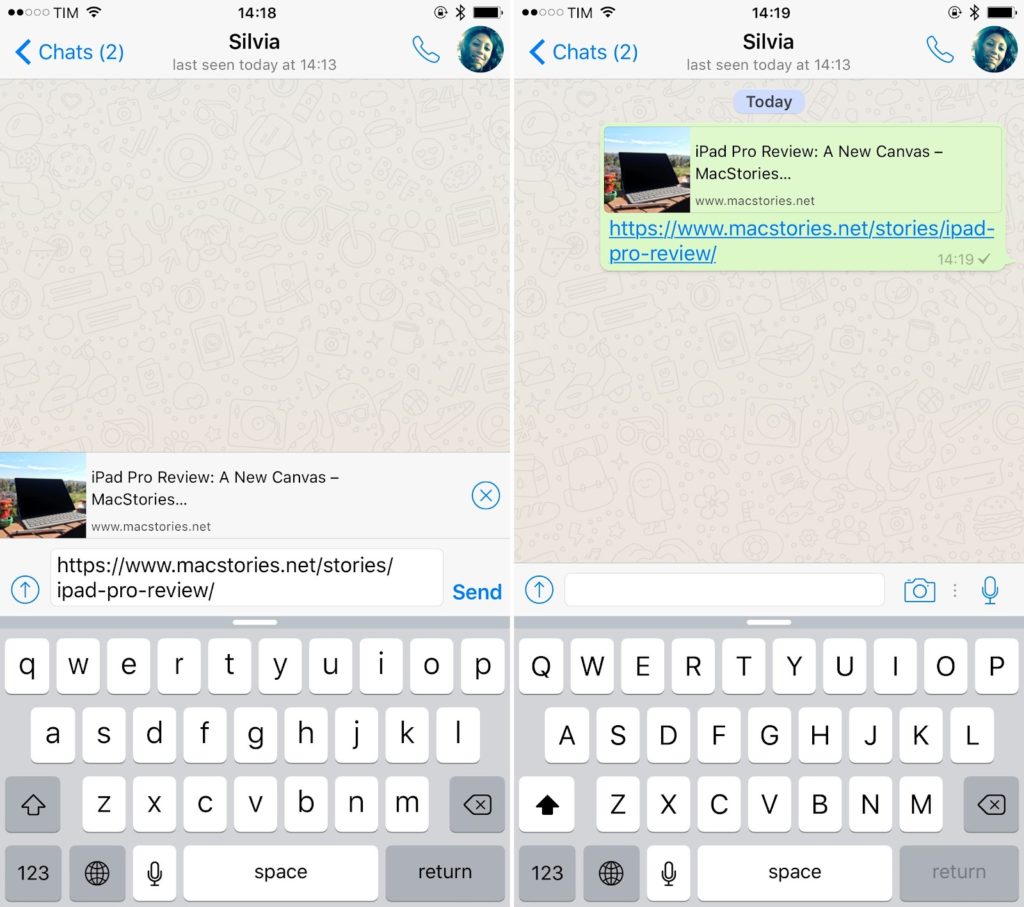
Traffic from such sources would show up under Direct traffic, which often has a high percentage of total traffic. However, dark social traffic can be largely minimised by adding UTM parameters to all links.
Lift analysis and how to calculate it
One way to work around the limitations of channel attribution in Google Analytics is to look at the company’s overall metrics instead. Compare the lift in your key metrics — traffic, leads or sales companywide — during the campaign time period to the same time period before or after it. This will show how much the campaign affected your company as a whole.
For example, a sales lift is the difference between actual sales during the campaign and baseline sales that would have taken place had the campaign not run. Baseline sales could be calculated as the average sales before and after the campaign. However, no other campaigns should be ongoing at the time, for the assessment to be valid.
The lift can also be shown as a percentage by:
(actual sales — baseline sales) * 100 / baseline sales
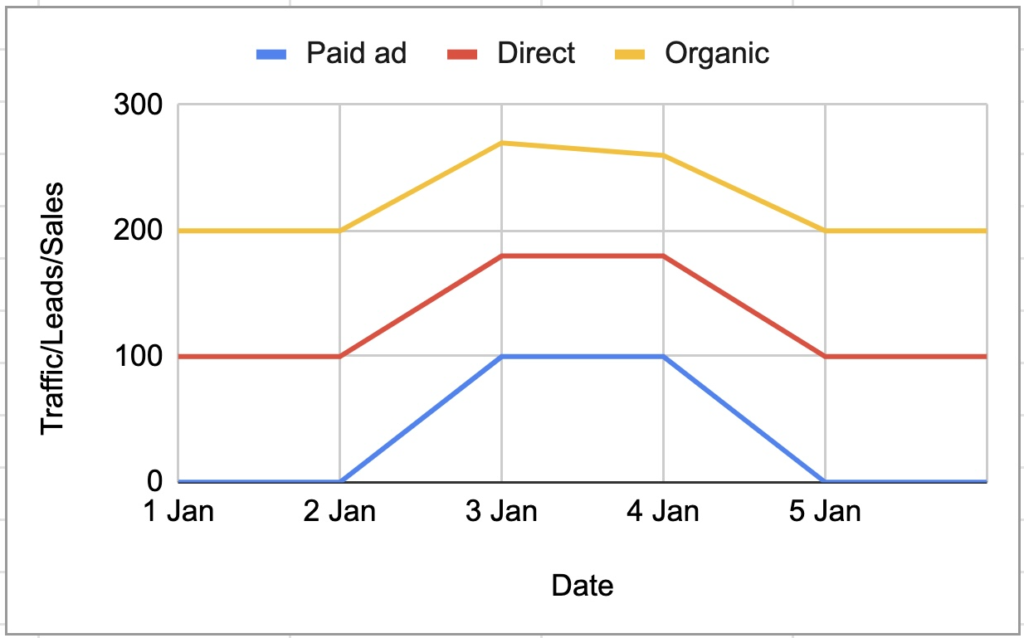
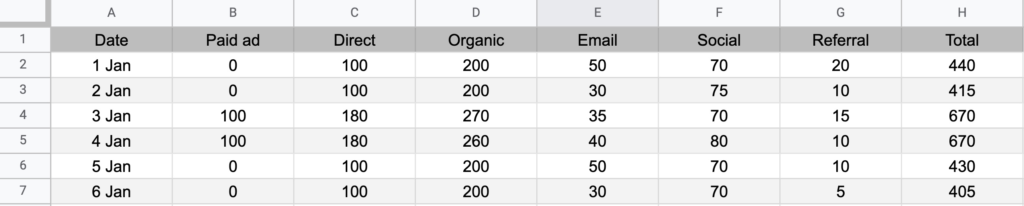
So, in our above example, we ran the paid ads for 2 days on 3rd and 4th Jan.
Here’s the template if you want to do the calculation on your own data: Google Sheet template
So actual sales on the two days = 670 + 670 = 1340
Baseline sales = average sales per day before and after the campaign, multiplied by 2 because the campaign was run on 2 days. So, (H2+H3+H6+H7)*2/4 = 965
So the total number of sales because of the campaign = 1340 — 965 = 375. Notice how this is much larger than GA’s tracking of only 200 (B4+B5) from the paid channel.
So, lift because of the paid campaign = (375*100/965) = 38.9%
However, we can’t say definitively that the 38.9% increase is because of the marketing campaign. Since it is not an actual A/B test, the results may not be accurate. External factors such as competitive marketing, sales contacts, product life cycles, economic conditions, and seasonality could affect sales.
But the low cost and low data requirements make it a good method, mainly for indication and directional feedback. For better credibility, you could use more sophisticated analyses like Marketing Mix Modeling and Causal Inference.
Limitations of lift analysis
Besides the lack of reliability in results due to external factors, doing a lift analysis can also sometimes be challenging. For big companies with multiple promotions happening at once, it might be difficult to isolate the impact of any particular campaign. You may need to turn off other initiatives before, during, and after the campaign you want to run and measure. This may require cooperation with teams outside of your own, and it may not be possible to do a lift analysis only in retrospect during the reporting period, depending on other marketing efforts.
Also, changes in seasonality and month may also impact the results. So it is best if the time periods compared are from the same seasons or months, if those make a difference in your industry.
Regardless, if you are a performance marketer, you are most likely having a much higher business impact than you think. Lift analysis might help you measure it more accurately.
Or try the following alternatives:
- Causal Inference: Replicate a laboratory experiment through techniques such as natural experiments, regression discontinuity, or equivalent methods.
- Marketing Mix Modeling: Employ multi-variable regression techniques or advanced algorithms lke Bayesian MMM, to assess the influence of each marketing channel.
- Geographical Test: Randomly assign a portion of geo-regions to undergo changes, and measure the variation in sales between control and test.