
You cannot double spend and expect sales to double. Advertising on auction-based platforms like Meta or Google exhibits diminishing returns, meaning as you increase spend, efficiency suffers. When you continue to increase your advertising spend you see increased customer acquisition cost (CAC) and lower return on investment (ROI).
Essentially, there’s a trade-off between spend and efficiency, which occurs because:
- The highest-intent audience (the low hanging fruit) has already been converted in the first few runs of the ad
- Expansion requires reaching less relevant or more expensive audiences to reach, harming average performance
- Ad fatigue sets in for audiences that are repeatedly exposed to your ads, hence they stop paying attention
Diminishing returns means there’s a ceiling to how much you can spend in a channel before it gets saturated. Creative testing can help improve the situation, as can better optimization to find new pockets of relevant audience, however if you’re going to navigate around saturation you first need to measure it.
Definition of Diminishing Returns
DR says that the output cannot continue to increase at the same rate after a certain point. After a certain point, also called the saturation point, each dollar you spend has a relatively lower impact.
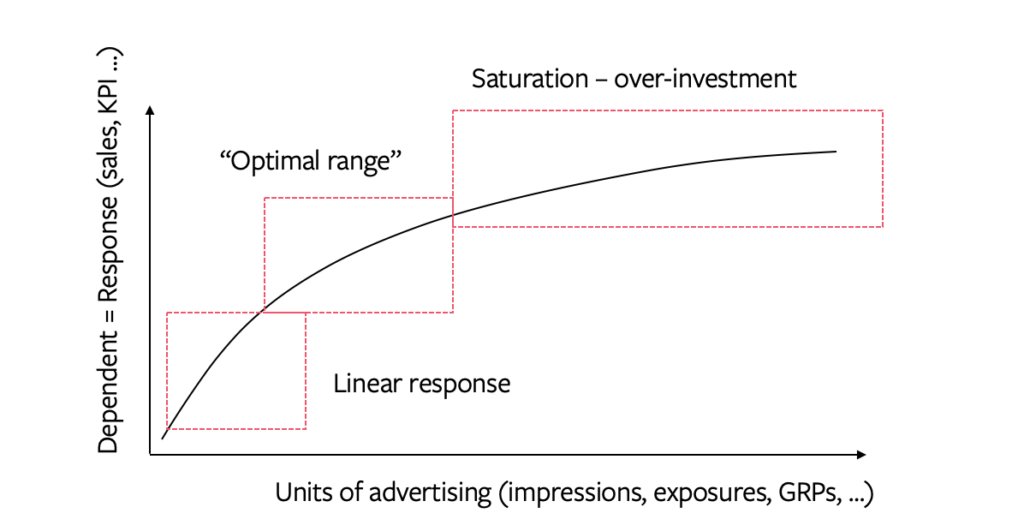
DR can be noticed in action if you plot a graph with money spent on the x-axis and the results achieved on the y-axis. The resultant graph is called a response curve.
In the below example, you can notice that the curve saturates at $5M. Increased investment no longer brings in any new customers.
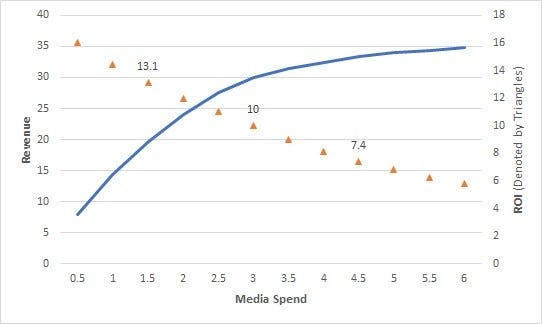
Finding out this saturation point for your campaigns is critical to figure out when to pause, continue, or tweak your campaigns to reduce wasted ad spend. That’s one of the things you get out of building a marketing mix model.
Types of response curves
Primarily, there are 4 different types of response curves:
- S-curve: S-curve has 4 stages: slow growth at first, followed by fast growth, then slow growth and then zero growth.
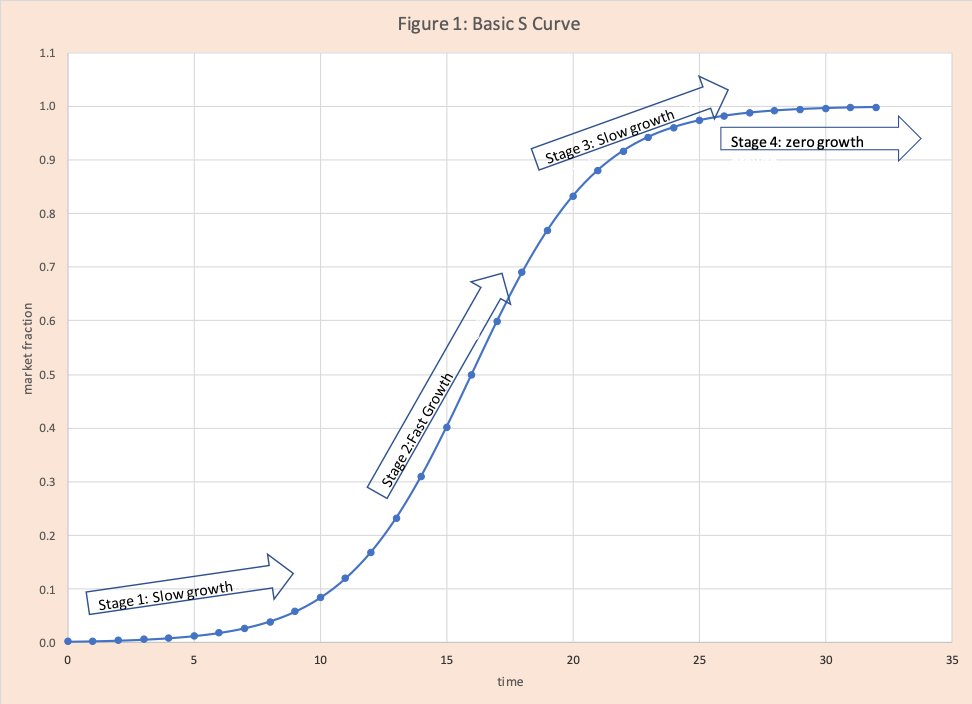
S-curve is arguably the most common curve in real-life marketing because we need repeated exposure before giving into temptation, writes Chris Kervinen from Sellforte. However, he adds, S-curves are hard to come across empirically because they require “substantially more variance in the data than what the usual datasets include”.
TV ads are one such example where S-curves can be commonly observed, both because of the mechanics of the channel, and because it usually is a sizeable investment with enough spend to determine the shape of the curve.
- Concave: Concave curves have a vertical line at first, followed by a steep drop-off. Advertising has a huge impact on sales initially, which diminishes quickly and finally saturates completely.
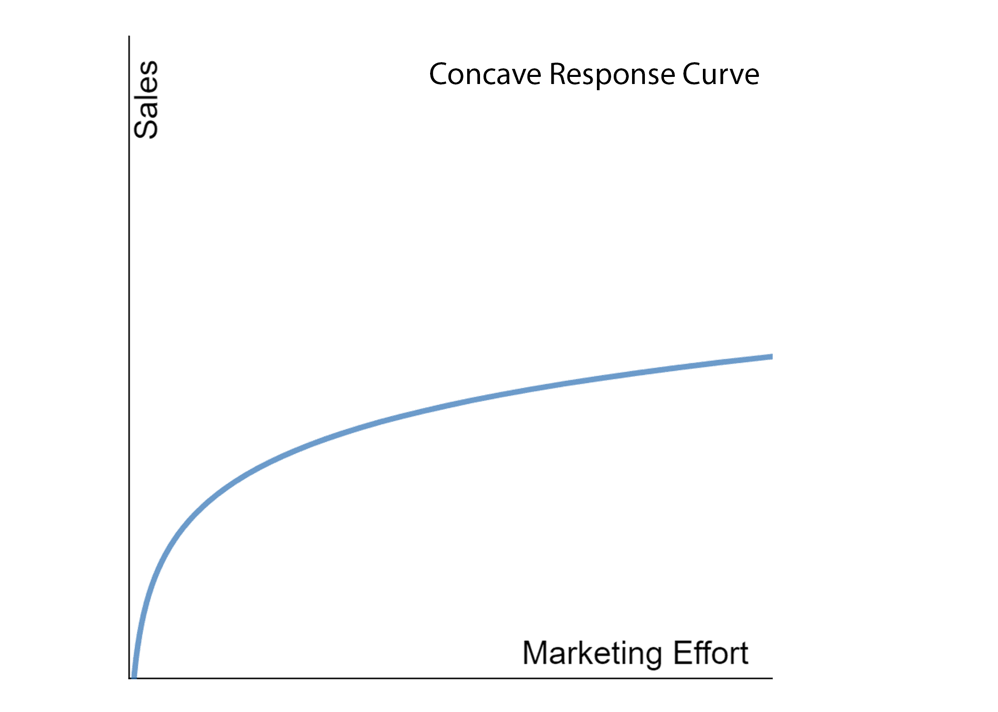
A company selling a one-time-buy item like a mobile phone might experience this. Once the high-intent audience has been converted, they won’t buy additional phones. Collaborating with the same influencer repeatedly would give similar results because you are not reaching new audiences.
This curve is the most likely to be seen empirically, and is a good default assumption when building a simple model.
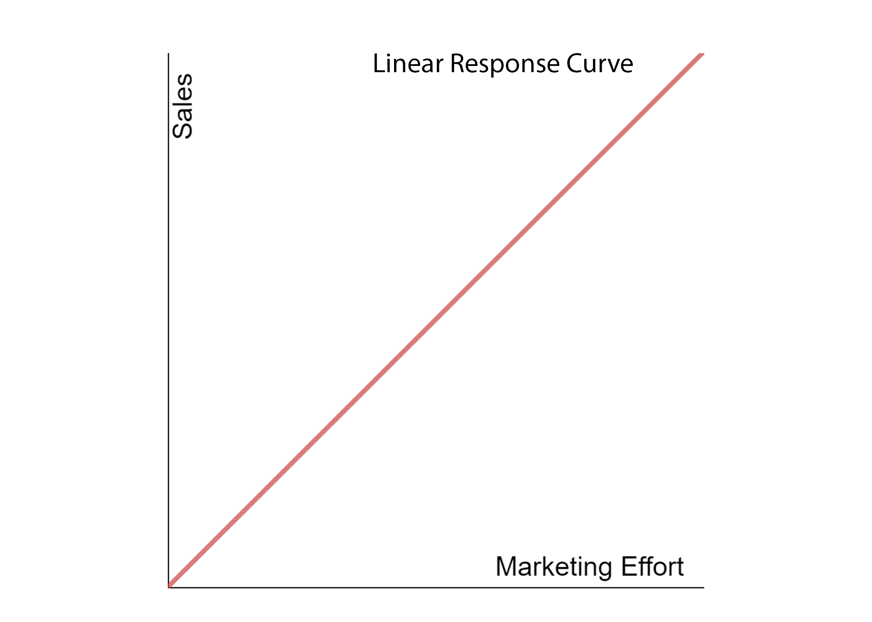
- Linear: Linear curves show that advertising has a direct impact on revenue. It is rare to find this curve. If you find that a channel shows a linear curve, chances are you don’t have enough data, you are not testing over longer time periods, and/or have only experimented at low investment levels that have not reached the saturation point yet.
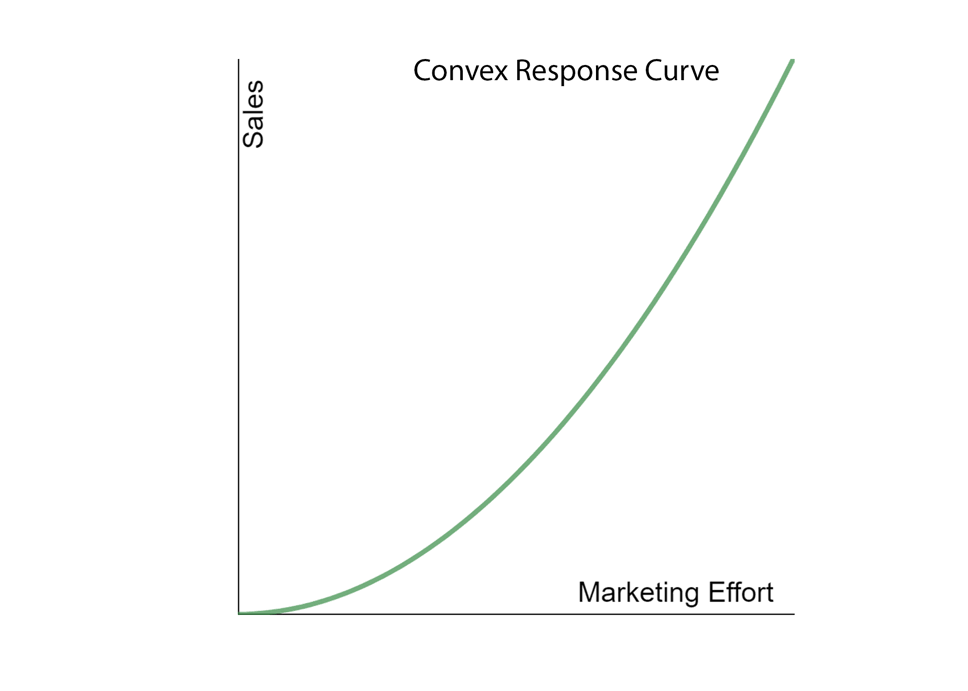
- Convex: A convex curve shows that an increase in investment results in an exponential increase in KPIs. Such curves are the least observed curves in marketing. It means that you are nowhere near the saturation point, or that there are natural ‘economies of scale’ in the channel, where performance increases as you reach the top. Organic channels like SEO can show a convex curve — SEO takes longer, but grows in value over time and that value compounds.
Saturation curves in Facebook’s Robyn
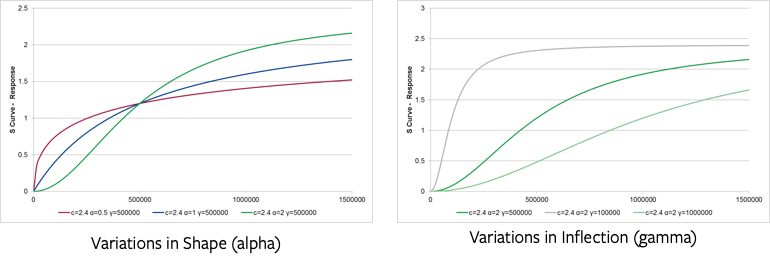
Robyn is an open-source MMM package by Facebook. Robyn’s default option, the S-Curve, has 2 parameters: alpha and gamma. Alpha controls the shape of the diminishing returns curve (how fast a channel saturates) and Gamma controls the inflection point (when a channel hits saturation). It finds the right values for these parameters using hyperparameter optimization with the evolutionary optimization package Nevergrad.
It shows the below 6 curves as examples of what shapes are possible with these two parameters:
How to calculate DR
For context, the approach laid out in this article is not reflective of how Recast approaches saturation and diminishing returns. The actual model specification can be found in the technical model specification.
That said, here’s how we generally see diminishing returns being calculated in MMM:
2 of the most common curves — S-curve and concave — show that the efficiency of marketing efforts declines exponentially.
Hence, we would add a power function to a linear equation (y=a*x):
y=a*x^B, where B is 0<B≤1
Here is real-world data in Google Sheets from Saxifrage to better understand this.
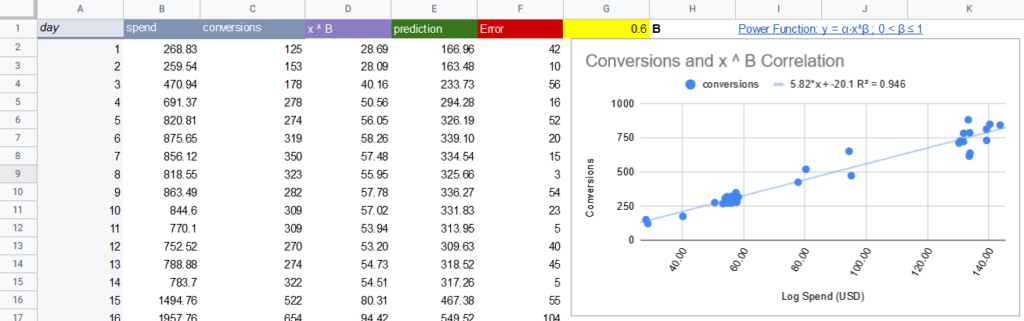
Find the value of B by “manually changing the yellow box (B from the equation) until the Prediction values line up with Actuals, the R-squared is at its highest and the Error is at its lowest,” writes Michael Taylor.
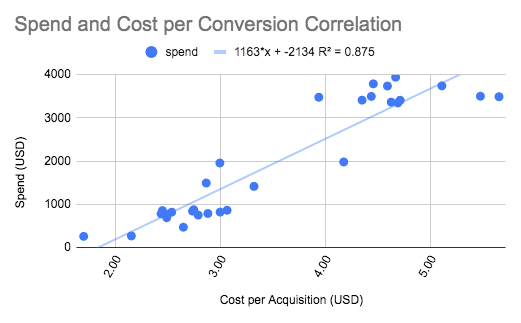
The coefficient of CPA (x) is 1163. This means that every additional $1,163 spent, will result in a $1 rise in cost per acquisition.
How to reduce the impact of DR
- Arrange media investments and set budget weights when you reach saturation points according to your model.
- Try improving current conversion rates and CAC by tweaking creatives and landing pages based on data. If done successfully, this will move forward the saturation point for that campaign.
- Invest in organic channels alongside paid channels.
- Optimise the media mix by prioritizing the channels that have not yet reached the saturation point. Go after the channels that are efficient and scalable. Or experiment with channels you haven’t yet tested to reach new audiences.
- Try reaching people in new geographies.
Conclusion
Continuously test more channels and model the results to figure out the efficiency, scalability, and saturation points of different marketing channels. It would help you be aware of diminishing returns, make appropriate changes, and reduce ad spend.