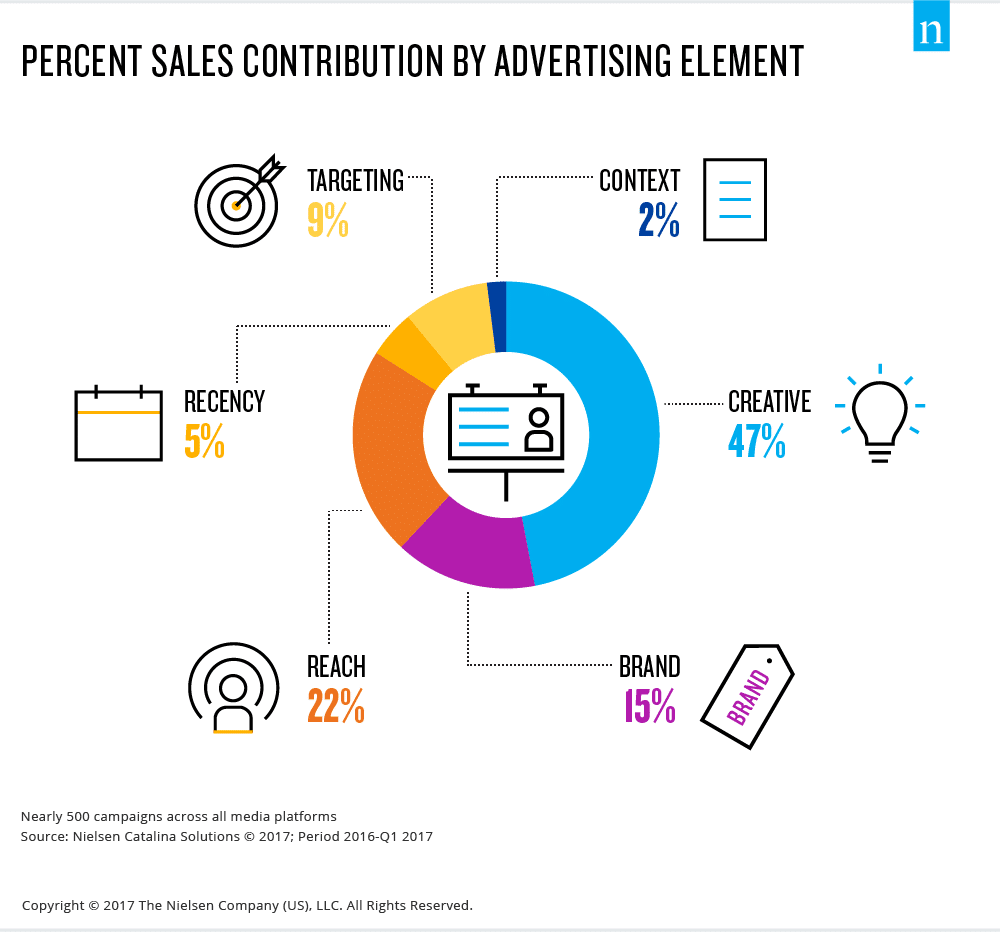
In 2017 Nielson conducted a study of 500 advertising campaigns across all major media platforms: TV, digital, magazines and radio. They found that a remarkable 47% of the campaign’s contribution to sales was attributable to Creative. A further 15% came from Brand, which we can think of as the culmination of past creative efforts. Despite all the focus in our industry on Targeting, it contributes only 9% of the success of the campaign. The biggest non-creative factor was simply Reach: how many people saw the ad.
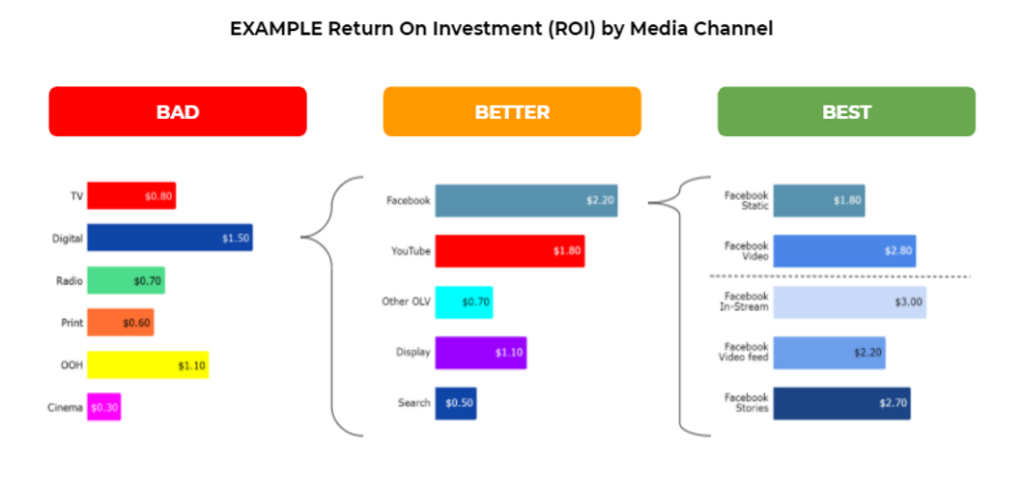
Despite the importance of Creative, most Marketing Mix Models (MMMs) do not account for creative performance. One dollar of ad spend on Facebook is treated the same as any other dollar spent on that channel, regardless of which ad was running. Even Facebook’s Robyn MMM tool only recommends including the format of creative (static, video, in-stream) rather than a granular view of which ad worked.
This fact is surprising for most people to learn. How can we accurately predict marketing performance if we’re not incorporating the most important factor in our models? In this post we’ll cover why ignoring creative is less problematic in practice than you may think, and the best way to include creative in your models if you deem it essential.
Bias-Variance Tradeoff: Why Creative Gets Excluded
While most executives are concerned about how to handle ‘big data’, most practitioners know it’s ‘small data’ that’s the problem. You never have enough data to validate all of the insights you want to prove. There are two sources of error that you need to trade off: Bias and Variance. Bias is when you underfit the data, because you didn’t include enough variables in the model. Variance is the opposite: overfitting the data because you used more variables than your model can support given your number of observations.
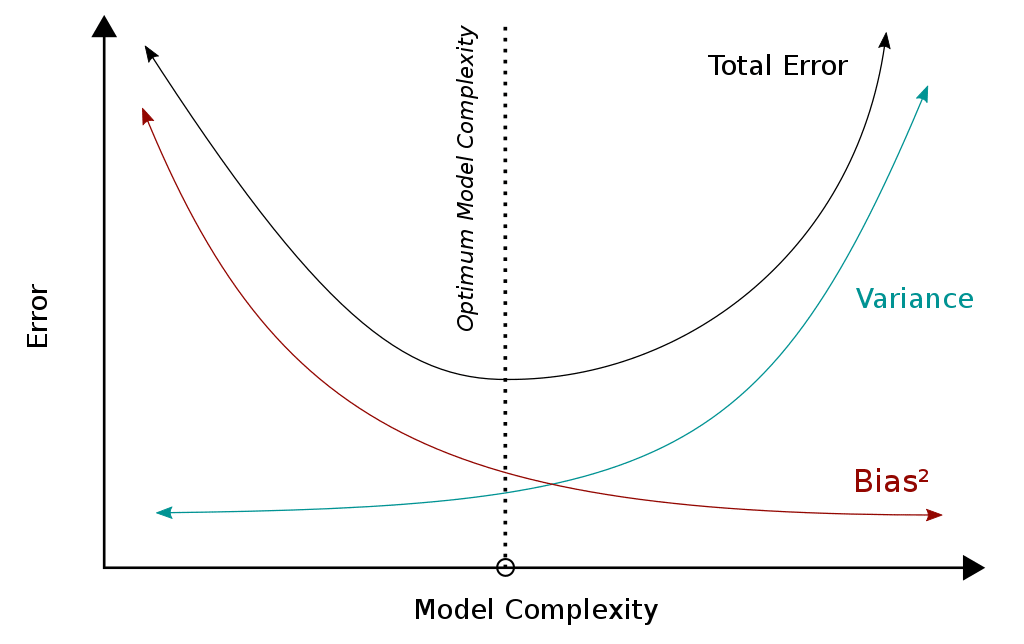
According to Chan & Perry 2017 “Challenges and Opportunities in Media Mix Modeling”, a rule of thumb for a minimum number of data points for a stable linear regression is 7-10 per parameter. If you’re building a marketing mix model using weekly data, you can quickly run out of available slots for variables. For example if you have 15 weeks of data, you can only include 4 variables (parameters) including the constant – that’s one per channel if we’re lucky enough to have a simple media mix. No room for further granularity in terms of what creative was running.
Milton Friedman’s Thermostat: Causation Does Not Equal Correlation
You’ve heard the famous saying “correlation does not equal causation” but it also goes the other way. Just because something isn’t correlated doesn’t mean there’s no causation. The famous example attributed to Milton Friedman is a thermostat. Because the thermostat turns on the heating to control the temperature, there’s no correlation between inside and outside temperature. The only correlation would be between outside temperature and the amount of oil burned by the heater, yet we know that without the thermostat cold weather would cause inside temperatures to drop. This isn’t a simple cause and effect relationship, it’s a dynamic controlled system with feedback loops.
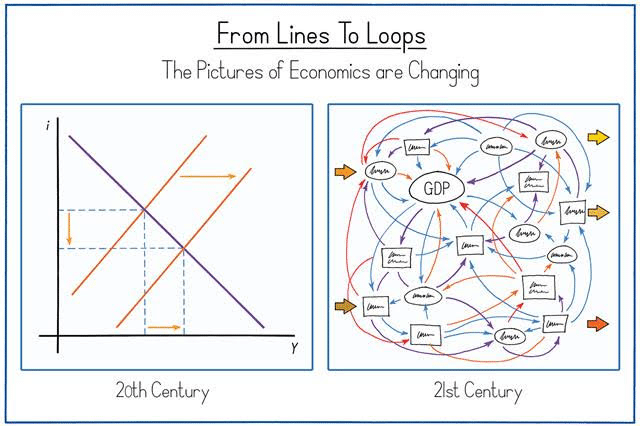
As well as being important in government policy, this concept shows up in marketing all the time. Whenever a creative performs poorly, if the CMO is doing their job that ad gets turned off. Additionally new creatives are tested all of the time to keep performance high and fight off ad fatigue. The result is similar to the thermostat: because the marketer is affecting control of the system, the impact of creative isn’t correlated with sales. We should expect short term creative performance boosts to quickly revert to the long term average, which is what’s most important to your model forecasts anyway.
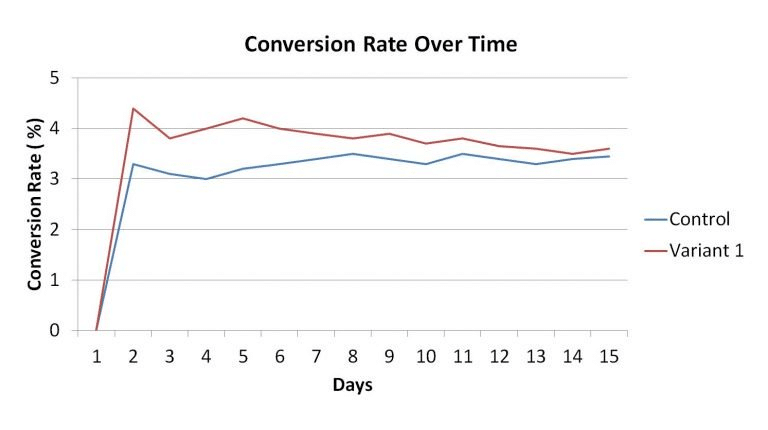
Statistical Significance: Most A/B Test Results Are Illusory
One truth that most executives are unprepared to hear, is that most of the ‘wins’ you think you’ve delivered in the past few quarters weren’t really wins. Statistical significance is declared by most people when the P value drops below 0.05. This does make the odds in your favor, but even if you did everything right that means 1 in 20 test results will be false positives.
Chances are your team isn’t doing everything right. Andre Morys of Web Arts suggests as many as 90% of positive results might be invalid because marketers stop them too early, before the performance difference regresses to the mean.
According to Harvard Business Review as many as 80-90% of A/B tests fail to reach statistical significance. These are variants the whole team agreed were the right thing to test, and still they have a 1 in 10 success rate. That’s just the changes important enough to run as experiments – you have to imagine the hit rate is even smaller for day to day optimizations. Since true big wins are so rare, it can be perfectly valid to leave the effect of this testing activity out of your model.
3 Methods for Including Creative in your MMM
Marketing Mix Modeling is a top down approach: it wasn’t designed for granularity. You should never expect to be able to track subtle changes to creative like “is the background blue or red in the banner ad” – other attribution methods like tracking pixels are better suited to that task.That doesn’t mean MMM has nothing to say about creative. Given the importance it can be worth modeling it, and there are existing techniques for doing so.
Creative Scorecards
If you can’t spare the variables to include creative in your model, one approach is to grade your creative using a scorecard. Rather than including a variable in your model for each creative, you score each creative against a list of best practice rules, then include the average score in your model. This is a method Facebook themselves recommended in an MMM webinar.
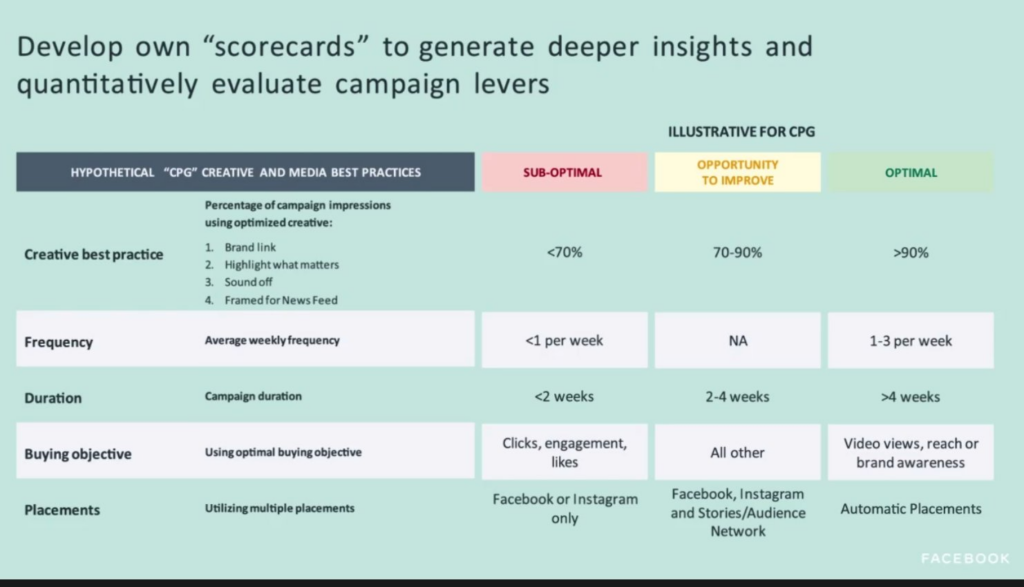
This is in effect a dimensionality reduction technique, like Principle Components Analysis – a way to decrease the number of variables in your model, while still capturing most of the variance in the data. It can be effective in practice though it relies heavily on the robustness of the rules you include. If they don’t correlate to creative performance they won’t work in your model.
Message Mix Modeling
This is a reformulation and extension to traditional Marketing Mix Modeling. Instead of focusing solely on media channels, with Message Mix Modeling, you measure the sales uplift and ROI of different creative messages. First you have to code your creative by categorizing them into high-level themes relating to your overall creative strategy, like ‘trust’, ‘quality’, ‘discounts’.
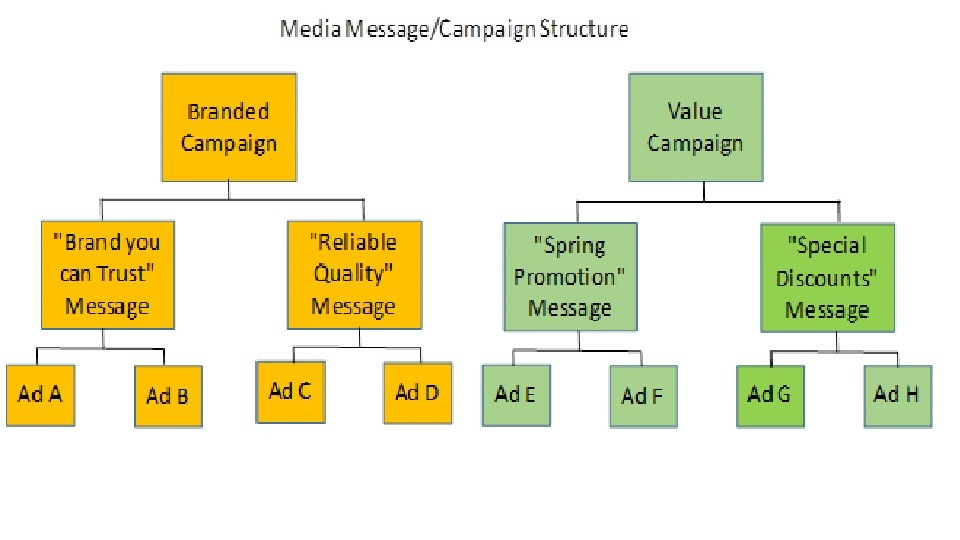
Once you have your campaign data categorized into a handful of messages, you use them in your marketing mix model in lieu of individual channel variables. For example instead of including TV ad spend in your model, you might have 3 TV ad spend variables: one for each overarching creative message. This risks upsetting the bias-variance tradeoff discussed earlier, but it can be a valid approach when the effect of ad creative is extremely important.
Hierarchical Models
At Recast we use Bayesian MMM, which gives additional flexibility in defining how variables are estimated in the model. One powerful tool is the ability to set priors, a method for telling the model what likely values the variable can take on. This means Bayesian techniques lend themselves well to Hierarchical Models, where one variable in the model impacts another, not just sales. For example a compelling TV ad creative would drive more searches for your brand term on Google (a different variable in your model), as well as driving sales directly.

The canonical way to include creative in a Bayesian model is to define each creative type, format or strategy as variables that “roll up” to the channel overall. That would let the model determine how much better or worse a given creative performed compared to the overall performance of the channel. The benefit of this technique is that it just predicts the baseline wherever you don’t have enough data on an individual creative tactic.
How does Recast handle creative performance?
Creative isn’t directly included in Recast’s models off the shelf for all the reasons listed earlier in this post, plus one other. Recast doesn’t model average performance for a channel for the full time period (like most MMMs), but allows channel performance to change daily. This is accomplished with Bayesian priors: the default assumption being that today will be similar to yesterday. This means that as your creative improves over time, our model picks it up and adjusts accordingly.
However Recast does have the capability to incorporate creative for clients that need it. In fact, because of the magic of Hamiltonian Monte Carlo and good use of priors, it’s safe to break the rule of 10 observations per variable: the typical Recast model has thousands of variables. As you can see from this post, modeling creative isn’t an obvious home run – rather it’s a complex topic with many considerations. If you find including creative in MMM is important, we’d love to hear from you!