Marketing efforts in one channel can impact traffic and attribution in other channels. This positive or negative interaction between different marketing channels is called the halo effect. Here are some common examples:
- Online social advertising impacts SEO: People see your ad on YouTube/Facebook/Reddit, and then they search for your brand name on Google later, thereby increasing your organic traffic. A 2021 study showed that advertising on YouTube can increase regular Google searches for your brand name by a whopping 420%.
- Google search ads impacts organic traffic: If you have 1 paid result, followed by 1 organic result on Search Engine Results Page (SERP), it increases the likelihood of a person clicking on the organic result.
- Traditional media impacts SEO: People come across your brand ad on TV/billboards/radio/newspaper. It leads them to search for your company name on Google, thereby increasing your organic traffic. Ex: When a brand runs a Super Bowl ad, they see an increase in direct and organic traffic.
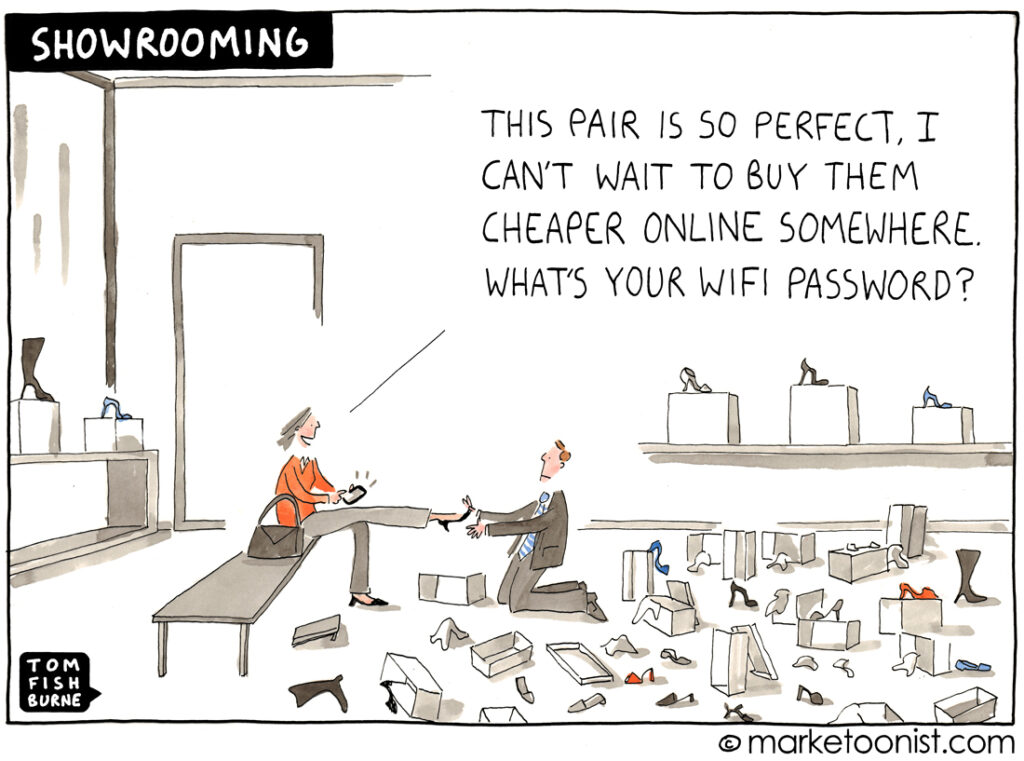
- Online advertising impacts offline purchases: People come across an online brand ad, they read about the features online, and then go purchase the product offline in retail stores because they need it the next day. This practice of conducting online product research before visiting a brick-and-mortar store to buy an item is also called web-rooming.
- Alternatively, opening a retail store in a city leads to a 37% increase in website traffic, according to a report by the International Council of Shopping Centers (ICSC). People go to a retail store to get a feel for the product, and then go buy it online at a cheaper rate.
- Amazon ads impact e-commerce sales long after the ad is run: Amazon ads help increase awareness and reviews of your product. The lag effect of the ad is seen as the product may now go on top of the search results organically because of increased interest and a high number of reviews.
- Upper-funnel efforts on one channel can impact brand perception and purchase decisions later down the funnel in another channel.
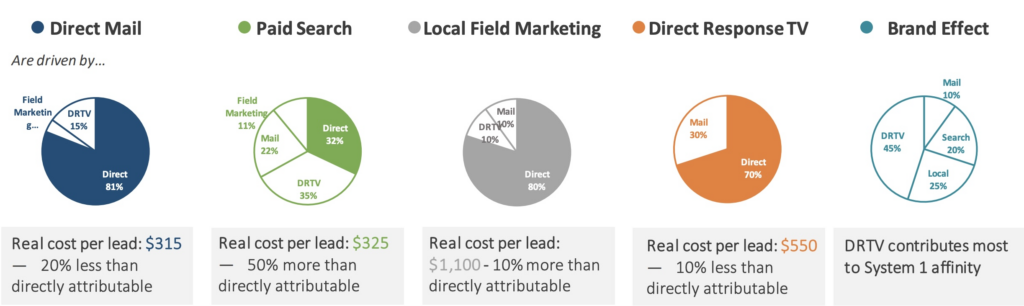
Measuring this impact between channels is extremely important to optimize the media mix: Heads of marketing usually allocate the budget per channel based on historic performance, reported on last-touch attribution. Based on these metrics, decisions that negatively impact business results could be taken, for example, with this case study, where TV budgets were reduced by 40%. To maximize value and minimize budget, true attribution of the direct and indirect value of each channel on itself and other channels need to be calculated.
Here is an example from Market Bridge on how the real cost per lead is different than initially assumed across channels for a sample business:
How to calculate the halo effect
The approach laid out in this post is not reflective of how Recast approaches cross-channel measurement and halo effects. The actual model specification can be found in the technical model specification.
But here are the most common ways to calculate halo effects:
One way to calculate cross-channel effects is through linear regression. Linear regression is a data analysis technique that predicts the value of unknown data by using another related and known data value. It mathematically models the unknown or dependent variable and the known or independent variable as a linear equation.
For example, to calculate the impact of Facebook ads on organic traffic, pull the data from Facebook ads (amount spent) and Google Analytics (impressions) into a Google Sheet. Here is a template of a sample calculation.
A regression analysis is run using the LINEST formula. As explained here, “The LINEST function calculates the statistics for a straight line that explains the relationship between the independent variable and one or more dependent variables, and returns an array describing the line. The function uses the least squares method to find the best fit for your data.
Simple linear regression equation:
y = bx + a
Where:
y – the dependent variable you are trying to predict.
x – the independent variable you are using to predict y.
a – the intercept (indicates where the line intersects the Y axis).
b – the slope (indicates the steepness of the regression line, i.e. the rate of change for y as x changes).”
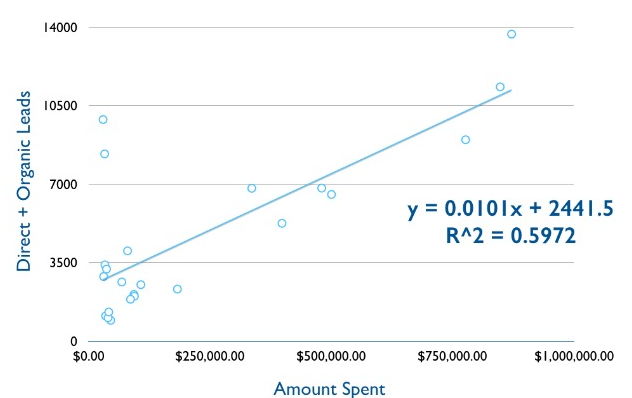
R^2 is “a statistical measure in a regression model that determines the proportion of variance in the dependent variable that can be explained by the independent variable. In other words, r-squared shows how well the data fit the regression model.”
The value of R^2 can be between 0 to 1. Anything below 0.5 shows a weak correlation, and anything above 0.5 shows a strong correlation.

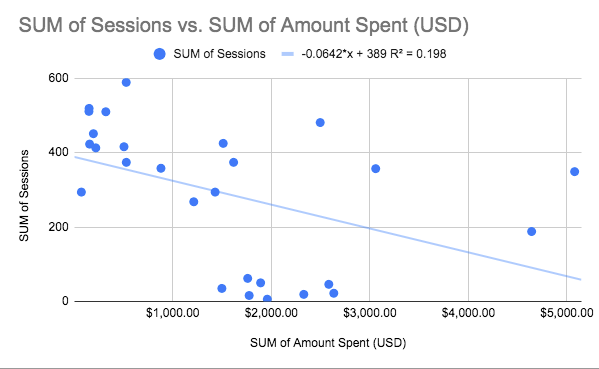
In the chart, a negative slope implies a negative impact, i.e the more Facebook spend, the lower the organic impressions. A positive slope means a positive correlation.
You might want to check how multiple marketing channels are working together: How did your ads on two platforms (let’s say Facebook and Youtube) impact SEO? Also, what is the impact on SEO when people see an ad first on Facebook and then on Youtube, vs when they see an ad first on YouTube and then on Facebook? To deal with multiple variables and conditions like this, you can run a more sophisticated full econometric analysis.
The equation for multiple regression looks like this:
y = b1x1 + b2x2 + … + bnxn + a
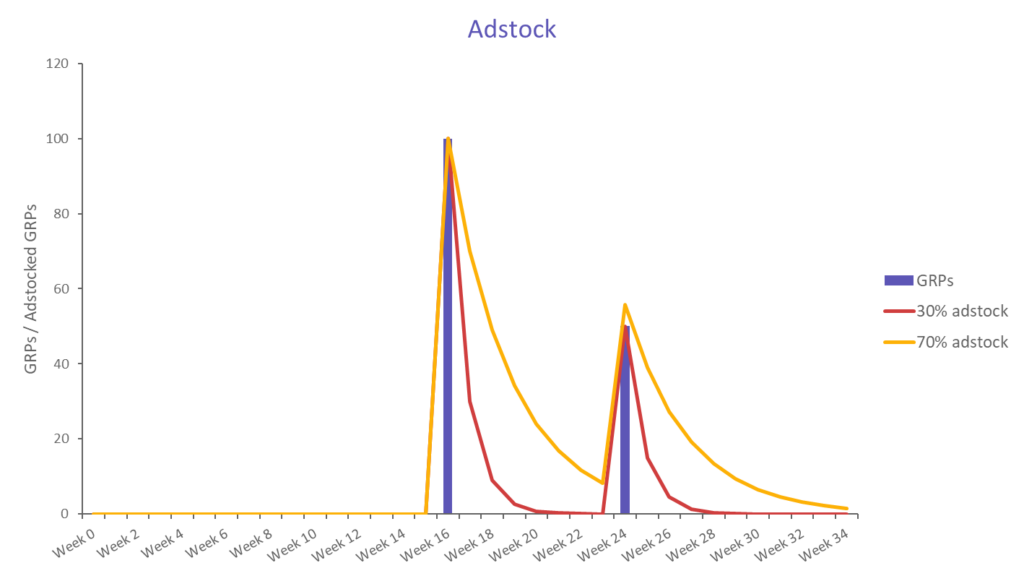
To measure the lag effect of channels — for example, the impact of Amazon advertising on e-commerce sales after the ad is run, or the impact of TV ads that are said to have a long-lasting effect — you assume an “adstock rate”, which is the amount of prolonged effect of advertising on consumer purchase behavior across time periods. For example, an adstock rate of 30% from week to week means 30% of the effect from last week is felt the week after the advertisement was run. The formula decays by 30% every week until the effect completely disappears.
Limitations and benefits of halo measurement
This method depends on correct data gathering. Also, there are multiple variables like competitive market and weather, things we may not be able to account for, which can impact the channels and may lead to inaccurate results.
However, regression analysis is helpful, especially now with stronger privacy policies, because it doesn’t require any cookie tracking.
Also, the industry currently over-reports trackable channels like email marketing and digital ads, while undervaluing non-tracked benefits and incremental campaigns. But because this analysis doesn’t require tracking user journeys via cookies, you can equally measure the impact of a billboard ad (with no clicks possible) as much as a digital ad on a channel like SEO.
You can also run the same analysis between ad spend and business results (like the number of leads generated, using goal completion data in Google Analytics). This will give the impact of paid advertising on business goals.
Chances are, you are currently understating or overstating the impact of some of your marketing efforts. In times when marketing investments are deeply connected to the ability to measure their impact on ROI, it can be beneficial to measure the cross-channel effects and impact of non-trackable channels. Such measurements can provide valuable insights for optimizing the media mix to minimize spend and maximize return.