
With privacy concerns on the rise and digital tracking becoming less reliable, marketers need advanced tools to measure the impact of their campaigns. Geo-testing has become an alternative used by many brands (often in conjunction with MMM) since it uses aggregate data and doesn’t depend on following people across the Internet.
Geo-testing is gaining the interest of data-driven marketers and we’re also seeing new developments and innovations in the space like the GeoLift library from Meta. If you are a marketing scientist, it should absolutely be a tool in your tool belt. In this article, we will explore its features and use cases so you can make more informed budget allocation decisions.
What is GeoLift?
Before we dive in on Meta’s GeoLift, let’s do a quick refresh on geo-testing. Simply put, here’s how it works (for a more in-depth explanation, read this) :
1 – You randomly choose a group of regions where you tend to advertise in (if you advertise in the US, you can pick 2-5 states).
2 – Then, you turn advertising off in those regions for a given period of time
3 – Measure the difference in sales in the control regions vs test regions
Okay, back to the GeoLift:
GeoLift is an open-source library from Meta to help marketers measure the true incremental value of their campaigns through geo-experimentation. The library uses Synthetic Control Methods to compare the performance of treatment and control groups across different geographical regions.
This gives marketers a robust and privacy-conscious solution for assessing how effective their campaigns have been. It’s worth noting that Google also has similar tools like Market Matching and GeoX.
GeoLift comes with three main benefits: it’s transparent and reproducible because it’s open-sourced; it’s resilient to signal loss because it uses aggregated, market-level data; and you can tailor it to fit your specific requirements.
How GeoLift Works and How to Use It
Let’s say you’re a D2C brand that sells jewelry and you want to:
- Measure the true incremental value of your ad spend. GeoLift will help you compare the outcomes of treatment and control groups.
- Calibrate your existing reporting models. GeoLift’s insights can be used to fine-tune attribution and marketing mix models.
- Ultimately, you want to allocate budgets effectively across channels and reduce waste while making better and more data-driven business decisions.
You’ve decided to leverage geo-testing and use GeoLift to run your experiment. Here’s what you do next:
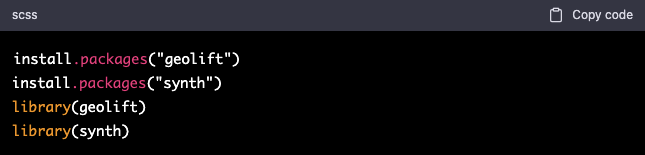
Step 1: Installing and Loading the Package
Before diving into GeoLift, you’ll need to install and load the required packages in RStudio. You can do this with the following commands:
Step 2: Data Preparation
Next, you’ll need to prepare your dataset with the correct structure and format. This includes geo-level information (such as zip codes, cities, or countries), KPIs (such as sales, conversions, or revenue), and date columns. To run a GeoLift experiment, you will need a dataset with at least six months of daily data or one year of weekly data broken down by geos (e.g., cities, zip codes, or countries). The dataset should include a minimum of 20 geos and a dependent variable (the KPIs we discussed).
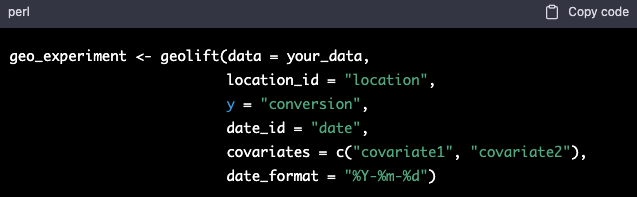
Step 3: Running GeoLift
To run the GeoLift experiment, you’ll use the geolift() function and provide the necessary parameters. You can load the dataset into RStudio and specify the columns for date, location, and the dependent variable (conversions). For example:
Step 4: Analyzing patterns between geos
Using GeoLift’s plotting functions, you can find the patterns between geos so it can create test and control groups with similar characteristics.
Step 5: Creating test and control groups
You can then define test and control groups based on the observed patterns to make sure there is a fair comparison of outcomes.
Step 6: Running market selection
Here you have to specify the parameters such as effect size, budget, and statistical significance and run the market selection process to estimate the treatment’s impact on conversions.
Step 7: Visualizing and Analyzing Results
With the experiment completed, you can use RStudio and the GeoLift visualization tools to analyze and interpret the results. Some useful functions you might want to use: plot() to visualize the synthetic control model fit and summary() to display a summary of the experiment results.
Step 8: Refining and Iterating
Based on the insights gained from your initial experiment, you may decide to refine your test design, adjust your marketing strategy, or run additional experiments. This iterative process allows you to continually improve your understanding of the true incremental value of your marketing efforts and make better decisions in the future.
This is the process of running a geo-testing experiment for your jewelry brand. You should leave the experiment with a clearer picture of how incremental your ad spend is and a better understanding of how you should be allocating your budget.
Conclusion
Running and measuring the true lift in a geo experiment isn’t overly complicated, but it’s not easy either. Meta’s GeoLift is a valuable tool that can really simplify the process of measuring the effectiveness of your geo studies. Michael, Recast’s co-founder, recommends it often.
We highly recommend using it alongside Recast’s MMM. Lift tests are very useful but are only snapshots of time. When paired with MMM, you get a fuller picture that will provide you more insights.
As privacy concerns continue to shape advertising, tools like GeoLift will become increasingly crucial for brands looking to stay ahead of the curve and optimize their budget allocation and overall performance. If you haven’t tried it yet, you should check it out.