Disclaimer: This blog post was written by an external contributor about their experience attempting to work with brand health data. This author lays out some very common issues, but this blog post is not reflective of Recast’s recommended best-practices approach.
Any consultant or analyst has projects which they regard as great successes, and will gladly talk about at length, maybe even writing case studies about them. But they will also have projects which went less well, and this is often where the best lessons are to be found.
One of the worst modelling projects that I have ever been involved in was for a small bank which had a significant halo from its much more significant parent brand which operated in a different sector.
The bank was commissioning a marketing mix model so that it could allocate its budget as part of their planning cycle, and needed to factor in the effect of the brand. With the bank being a smaller part of a larger whole, movements in brand awareness of the parent company could be a significant factor in driving sales.
The project had been designed such that there would be a nested modelling approach (where one KPI is the explanatory variable of another, usually further downstream in the customer journey). In this case, the client had brand tracking data which they wanted to include in the sales models. Their measured Awareness would be an explanatory variable of their measured Consideration, which in turn would be an explanatory variable of sales across a whole range of products. (It was also significant that the client marketing team was at that time bonused on improving the Awareness and Consideration scores.)
The modelling problem was immediately apparent upon looking at the data. Both of the brand tracking metrics were extremely unstable, with relative fluctuations of as much as 50% from one month to the next. That is, one month their consideration would be 25% and the next month it would be 40%. Meanwhile sales of the products stayed quite low throughout except for occasional spikes which tended to coincide with specific rate promotions. It should be obvious that the wildly varying brand awareness metric does not have much of a relationship with the fairly static business KPI. No amount of modelling would change that. The awareness variable is certainly not going to be regarded as a significant driver (unless perhaps there is a counterpart variable moving in the opposite direction).
Not only was it a challenge to nest the variables, however, it was also very difficult to model the brand metrics themselves. The marketing budget was quite modest, and really didn’t align with the spikes that were in the data.
This was a bit of a puzzle – the concept seemed to be sound, based on the standard marketing funnel theory. So, what was going on?
Soft vs Hard Metrics
Awareness and Consideration are examples of what are often termed “soft” metrics as opposed to the “hard” metrics of unit sales, revenue, etc. This difference in classification is essentially one of robustness. With any EPOS (electronic point-of-sale) or e-commerce platform (or, indeed, a set of accounts) you know exactly what you sold, when and for how much.
Softer metrics tend to be obtained through survey data and are thus much less reliable than a record of what people actually do. The great ad-man, David Ogilvy, summed it up like this:
“The trouble with market research is that people don’t think what they feel, they don’t say what they think and they don’t do what they say.”
This means that even if you conduct the perfect survey, you cannot always be sure that the data in front of you is “the truth”, especially when asking people about their beliefs or behaviour. You may also see it described as “claimed data”, i.e., it is what people claim they will do, as opposed to what they actually did.
There are echoes here of Stamp’s Law, named after the English economist Josiah Stamp who popularised it:
“The government are very keen on amassing statistics. They collect them, add them, raise them to the nth power, take the cube root and prepare wonderful diagrams. But you must never forget that every one of these figures comes in the first instance from the village watchman, who just puts down what he damn pleases.”
Despite this, survey data may still be the only way of attempting to measure certain things, especially if it concerns what people may do in the future, and where there is no hard data available. You just need to remember the implicit weaknesses.
It’s about the numbers
One other important thing to remember is that life isn’t fair. If you are a big brand, you need to spend far less on measuring your brand awareness to a certain degree of accuracy than if you are a small brand.
For example, if you think that only one person in a thousand has heard of your company, you will need to survey several thousand people to achieve a decent estimate. On the other hand, if you think that 50% of people are aware of you, then surveying a couple of dozen is probably sufficient to confirm that.
An estimate for required sample size can be obtained using the equation

Where n is the required sample size, while B is the margin for error on either side of the estimate.
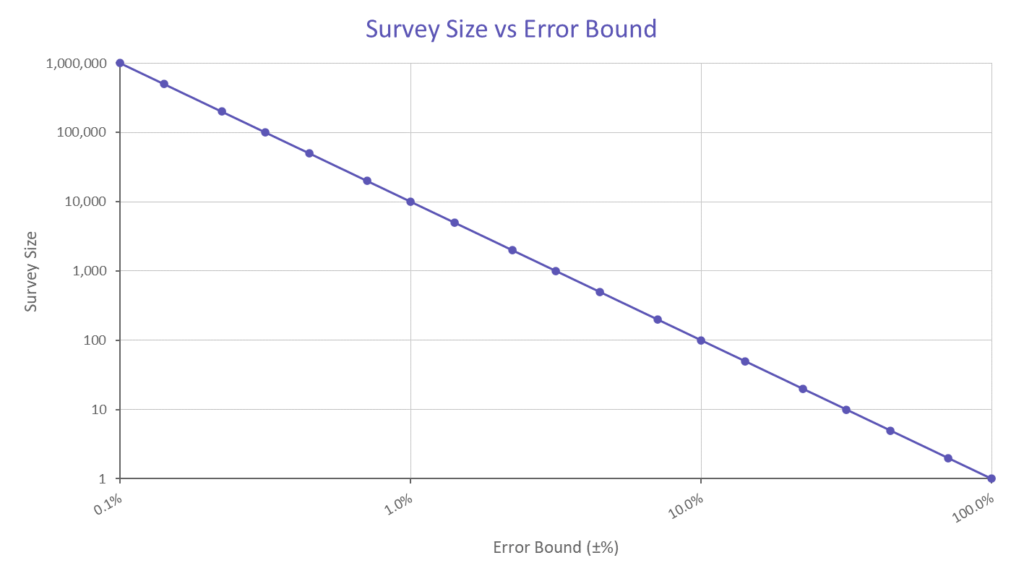
To be fair, if you want to measure awareness to an absolute precision of 0.1%, then you need the same number of people in the survey, regardless of your brand size. But if relative precision will suffice, then the sample size can be smaller, i.e., The relative difference between 1% and 1.1% awareness is more significant than that between 75% and 75.1%.
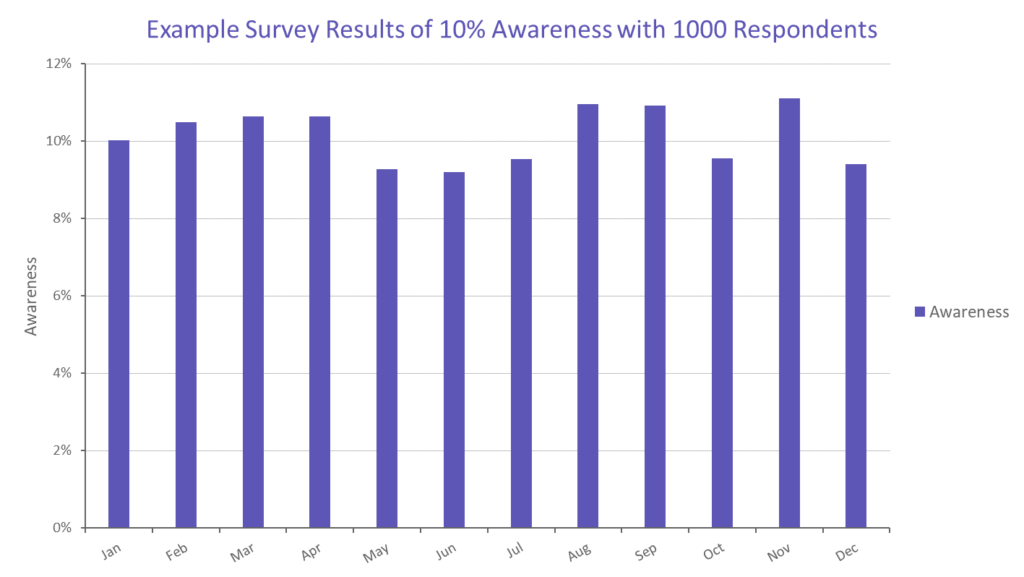
The most common failing of brand awareness surveys is that they simply aren’t big enough. Many companies choose to have monthly tracking surveys of a relatively small number of people which results in a series which varies more through plain chance than through any underlying changes. From the chart above, if you sample 1000 people, you can be 95% certain that the true answer is ±3% from your measured result. So, if your “true” underlying awareness is 10%, you would expect to see variation in the result between 7% and 13% purely due to randomness in the survey (example in the chart below). The problem arises when these movements are instead taken to be evidence of significant change in the underlying true awareness.
Back to the modelling
I didn’t really know any of the theory of sample sizes at that point in my career. But I was somewhat frustrated at making zero progress with the modelling so I asked for the raw data behind the brand metrics so that I could dig into it. And even to a novice like me, it was obvious that the sample size of the survey was extremely small – perhaps a hundred people per month. The awareness of the client’s brand, especially compared to the other banks presented in the survey, was far too small to be accurately tracked using a survey of this size. The problem only worsened for products like car insurance, where the qualifying question (“Are you currently in the market for car insurance?”) immediately removed 92% of the already-small sample. The result was that for certain products, the brand metrics were based on whether 1, 2, or 3 people in that month were positively inclined towards that brand!
No wonder it was impossible to model – almost all the movement in the data was measurement noise, dwarfing any real change that may have been occurring.
Imagine for a second that there was somebody on the panel that loved the brand and always marked positive on the survey (when asked). Because sampling is done at random, some months we ask that person, and others we don’t. If everybody else is ambivalent about the brand, we’ll see huge swings depending on whether that person made it into the sample. If they just happened to be asked for the past 3 months in a row, the team would slap themselves on the back and collect their bonus, even though their inclusion was at random.
Eventually, I complained so much that the project was given to someone else who produced a series of models of Awareness and Consideration which made no sense, inconsistently assigning spikes to random activities in other product lines, while the sales models gave almost zero weight to the brand metrics. The only finding of any real merit was the one that wasn’t presented to the client – they should stop wasting their money on brand tracking surveys of insufficient size.
Is this the best way of measuring brand awareness?
There are alternatives to using survey data. For example, brand awareness also tends to be closely correlated with market share. This should hardly come as a surprise – you (or other people like you who are in the market for the product/service) probably buy the products that you recognise, and your level of recognition gets a boost every time you open the cupboard and see it there, or receive a customer service email.
The double jeopardy law of marketing states that the lower-market-share brands in a market have both far fewer buyers in a time period and also lower brand loyalty. Byron Sharp details this in “how Brands Grow, but also refers to the cause in a blog post:
The statistical explanation of Double Jeopardy is that it is a selection effect. Because brand share depends largely on mental and physical availability, rather than differentiated appeals of different brands. For marketers this is pretty important, pretty insightful, we wouldn’t get Double Jeopardy if brands were highly differentiated appealing to different segments of the market. Since we do see Double Jeopardy all over the place that suggests that real-world differentiation is pretty mild. Mental and physical availability must be a much bigger story than differentiation. That’s a very important insight.
So if we agree with this conclusion then it stands to reason that we can take market share as a good proxy for mental availability, i.e., brand awareness.
There are exceptions; for example, I would suggest that Lehman Brothers still has a higher brand awareness now than it did pre-2008, but for all the wrong reasons. And it certainly doesn’t trouble the market share indices. However, for most companies, market share is probably a good enough stand-in when surveys are impractical.
Another measure that has received interest of late is “Share of Search”, i.e., the proportion of internet searches in the category that refer to your brand versus your competitors. While it not work perfectly for all categories, it does have
Does this mean that tracking measures should be ignored completely? Not necessarily. It might be worth doing a much bigger survey once a year to see whether market share (or share of search) is indeed closely matched to awareness.
A blockbuster success!
The wrong conclusion to make from this episode is that survey data is useless: If you’re careful about sample size you can make good use of it. I once did a piece of work for a movie studio who wanted to predict which movies should receive additional marketing budget that could help push them from being a moderate success to being a blockbuster. They ran surveys at regular intervals asking cinema-goers about upcoming films from about 16 weeks pre-release to the week of release itself. For each film, there were four metrics that were tracked: Unaided Awareness, Aided Awareness, Definite Interest, and First Choice.
These metrics were then correlated with the box-office takings in the opening weekend and over the entire release period and tested for their usefulness in predicting which films would be successful early enough to run additional marketing.
As it turned out, only two of the metrics bore any relationship at all to the success – Unaided Awareness and First Choice. The number of people who were excited enough about a film to mention it spontaneously and those who were already planning to see it strongly correlated with revenue, and the relationships were apparent from as much as 12 weeks in advance. Whereas the number of people who vaguely remember hearing about a film when the researcher asks about them, or who are polite enough to say they might be interested in seeing it, is a poor metric for this purpose.
Conclusion
As with any analytics problem, it is not possible to consider the separate parts of the process in isolation. For the banking problem, the measurement technique, and the resulting data, was incompatible with the modelling approach that was chosen. Time-series regression analysis is entirely dependent on movements in the explanatory variables being more signal than noise. It is also unwise to insist that certain variables must be part of the model, which is what the nested approach entails. Finally, the journey from the slightly vague concept of Brand Awareness to sales of a financial product is quite complex, and not easily unpicked with a regression model.
On the other hand, asking people whether they had heard of an upcoming film in the months prior to release is much more obviously connected with attendance and the less-sophisticated technique of simple correlation analysis was well suited to deriving insight and producing actionable results.
If you want the right answers, you need both the right data and the right model.
Disclaimer: This blog post was written by an external contributor about their experience attempting to work with brand health data. This author lays out some very common issues, but this blog post is not reflective of Recast’s recommended best-practices approach.