“There is nothing so stable as change” – Bob Dylan
Why Measure Model Stability?
Media mix models (MMMs) need to be actionable for marketers. If an MMM produces wild swings in output every time it receives new information, it indicates that there is something wrong with the model and it can’t be trusted for decision-making purposes. This is why model stability is so important.
Imagine you’re in the market for a new car. You have a model that tells you which cars are the safest. Two weeks ago, it said that Sedans are the safest. So you started looking for Sedans. After seeing last week’s crash data, the model updates and says that Hatchbacks are the safest cars. So you pivot your search, until this week, when your model updates again and says that SUVs are now the safest cars. Choosing a car based on this unstable model sounds like a nightmare.
To assess how sensitive a model is to new data, Recast runs an important model validation check called a Stability Loop when building models for our clients. Stability loops mimic the weekly refresh process that our other clients actually go through.

At Recast, we refit the entire MMM model each week, incorporating new data from the preceding week. While we expect small historical revisions (e.g. you gave us estimates of affiliate spend, and you’ve replaced them with actual values), the biggest change we expect during a weekly refresh is one additional week of data. Stability Loops look at multiple models, each with 1 additional week of data and quantify how similar their estimates are.
We want the model to learn from new data, but one week of new data (out of 100+ weeks of cumulative data) shouldn’t cause huge changes in the model’s estimates. Stable estimates week-to-week are evidence that the model is a) picking up on consistent signal from the data, rather than overfitting to noise in the data and b) is robust to seeing slightly different time ranges.
Stable estimates week to week also allow you to make confident decisions about marketing spend based on the MMM outputs. If your MMM told you last week that Facebook Prospecting has an ROI of 20, but this week it tells you that the ROI is 0.3, it would be difficult to rely on the results for decision making.
How is Stability Measured?
Useful MMMs don’t just give you a best guess for a parameter (a point estimate, like the mean or median value), they also give you uncertainty around that guess like a confidence interval. While the model’s best guess might vary a little week to week, the uncertainty interval given by the model should be similar week to week.
There are many ways we could define the uncertainty interval, but two related things should be considered when choosing one:
- How precise the uncertainty interval is
- What range of reasonable scenarios our range should cover
As an extreme example: if your only goal is not to be wrong, an incredibly conservative model could hedge its bets and tell you that your ROI in a certain marketing channel will be between 0.000001x and 1,000,000x. The actual ROI is certainly in that range (hitting #2, it covers all reasonable scenarios) but the uncertainty interval is un-actionably large (missing #1). There’s no way to effectively plan a marketing budget based on that range.
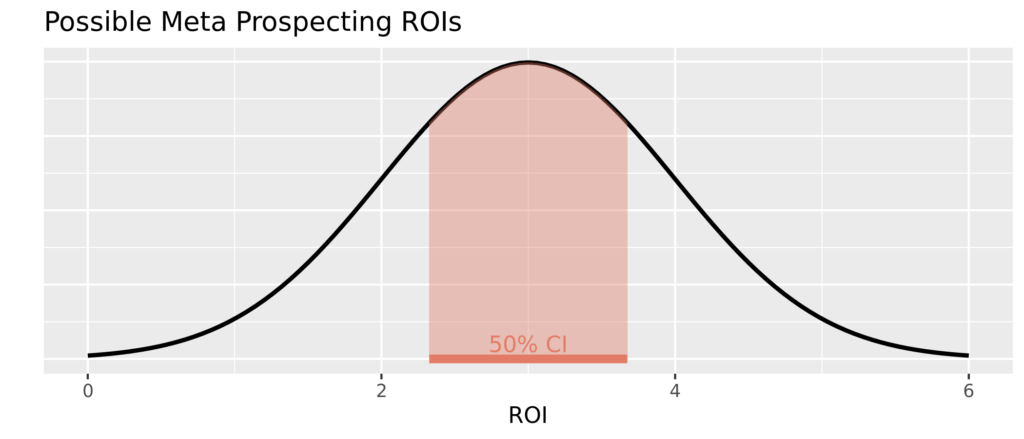
At Recast, we use a Credible Interval (CI) that contains the middle 50% of our model’s estimates as the uncertainty interval.
That means that based on the data and our assumptions about how your business works, we believe there is a 50% chance that the actual values (like ROI, CPA, or baseline sales percentage) lie within this range.

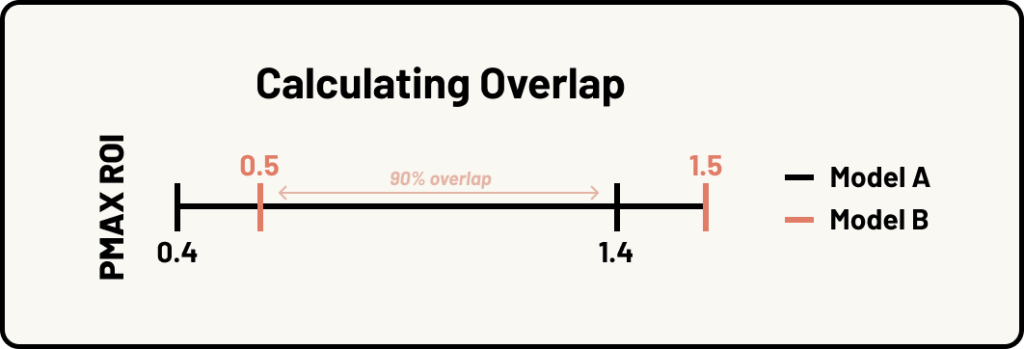
For a single model parameter (like the ROI of Non Brand Search) stability is the amount of overlap between the uncertainty interval for last week’s model and the uncertainty interval for this week’s model.

To get technical, the overlap is the difference between the smallest upper bound of the two intervals’ upper bounds, and the largest lower bound of our two intervals’ lower bounds. This overlap should be wide compared to the width of the intervals themselves if the models’ estimates are stable. If Model A thinks Google PMax has an ROI between 0.4-1.4 and Model B thinks Google PMax has an ROI between 0.5-1.5, the overlap would be 1.4 – 0.5 = 0.9. Because the width of both intervals is only 1, the fact that they overlap by 0.9 means there’s a 90% overlap between the intervals!

When comparing two models, this overlap percentage is calculated for every parameter in the model. For example, we need to calculate stability for each channel ROI. But not every channel has the same potential impact on your KPI. If the model estimates a high ROI for a channel, even small changes in spend can have a huge impact on overall marketing performance.
So, when stability is calculated for the model as a whole, the overlap % for each parameter is weighted by its typical value. A channel whose estimated ROI is 13 will “count more” towards the overall stability estimate than a channel with an estimated ROI of 0.01 because it has the potential to make a bigger impact on overall marketing performance.
How Do You Assess Model Stability?
Stability of your model estimates is important if you’re going to base budgeting decisions on MMM outputs (and why else would you invest time, effort, and money into an MMM?) But, how do you tell when a model is stable enough?
Stability should be high, but it will never be 100%. It might be 75%, or 90%. Not only might the model learn new information and revise estimates from the extra data provided, but there’s also some randomness involved in estimating a model (especially a Bayesian model like Recast’s MMM) which would make our estimates slightly different from run to run, even when nothing in the data changes. The level of stability you need is dependent on your business and how you’ll use the MMM to make decisions, so think about these two things when assessing model stability:
- Expected Instability: if you run a go dark or lift test and the model gets a precise estimate of the lift in a channel, we want the model to revise historical estimates around the test to align with the test results. Or, if you have big historical revisions in the data, or any other new information you provided to the model, you want the model to learn from that. This may cause revisions in the model’s estimates and therefore, lower stability. But that’s a good thing, the model should change its mind in the face of new, better information.
- Amount of Uncertainty: Stability should be considered in conjunction with useability. The narrowness of the intervals you get from your model and your decision making workflow will impact how much stability you need in order to make reliable decisions based on your MMM output. If the intervals of reasonable values are narrow (e.g. Non Brand Search ROI is between 0.1-0.15 for model A and 0.12-0.18 for model B) even slightly unstable estimates might give results similar enough to make confident decisions. With very wide intervals (e.g. Podcast ROI is between 0.1-10 for model A, and 0.2-12 for model B), even high stability might not be enough to move forward confidently.

The Wrong Way to Achieve Stability
At Recast, we are measuring true model stability because each run of the model knows nothing about previous runs. It’s a true “clean slate” run every time. This means that the measures of stability are truly measuring model “robustness” to changes in the underlying data.
One easy way to achieve high model stability would just be to force each model run to be similar to the others, either via priors or by over-writing results. This is cheating and means that this check is no longer checking the model’s robustness.
For example, we have heard of vendors doing things like “freezing coefficients” between models where they simply overwrite the new results with results from past models. This is bad practice and is effectively just lying about the model results. A similarly flawed practice to look out for are vendors that claim stability by simply not refreshing their model very frequently.
Open-source packages like Robyn let you use a “model refresh” feature that allows you to run Robyn on new data. It’s important to know that under the hood Robyn is forcing the update to be similar to the last run, and so you can’t use this method to validate robustness. Using this sort of “refresh” methodology will generally give you very different results than if you ran the model from scratch. So you better hope that the model was right the first time you ran it!
Final Thoughts
Stability is key, especially in something as dynamic as a bayesian media mix model. Stable estimates allow your model to learn slowly but surely from new information while providing output that doesn’t jump around wildly from week to week.
Why is this so important? When you have trust in your MMM, you’ll feel confident making strong bets with its recommendations that will improve your marketing program over time. Working with a robust, stable and accurate media mix model is critical to gaining this confidence, which is why we place so much emphasis on these features at Recast.
1. The average magnitude of the 4 bounds: |(Model A lower bound + Model A upper bound + Model B lower bound + Model A upper bound)|/4


