If you’ve ever worked in marketing you’ll hear the word “incrementality” constantly. Incrementality doesn’t care about someone who happened to see your Facebook banner ad before converting. It cares about people who converted because they saw your Facebook banner ad. It is a causal question: is marketing causing conversions? And causal questions require you to think about what would have happened had someone not seen your ad (the fancy term for this is the “counterfactual”).
What we’d really like to do is get a quantum physicist, create two parallel universes that are identical except for whether or not you showed each user an ad, and observe what happens. Unfortunately physicists have “morals”, and “strong ethical concerns” about helping you, so instead you turn to the gold standard of measurement: experimentation.
We choose some people to show ads to (treatment) and some to not show ads to (control). Often we use random assignments (like in-platform tests) to attempt to make sure that your treatment and control groups are not systematically different before treatment. If the groups are similar before treatment, we assume that after treatment, the control group is a good prediction of the treatment group’s behavior had it not been treated (the counterfactual).

Matching
And when your groups are thousands if not millions of individual users, nearly all of the time, the two groups will be similar enough that comparing them is nearly as good as being able to compare parallel universes. But often, we don’t have that many users. Or maybe we’re not experimenting with users at all, but with a small handful of geographic regions like DMAs (Designated Market Areas) in the United States or Cantons in Switzerland or Prefectures in Japan. With a smaller number of units to work with, the probability that there are noticeable differences between your treatment and control groups (maybe New York, LA, Chicago, Houston, and Phoenix, your main demographic, all end up in the control group) can be high. This can impact your analysis by making it look like the control group is actually better than the treatment group, just because your best cities all ended up in the control group.
In these cases, we can’t rely on pure randomization to get us a control group that is similar enough to make a clear comparison.
Luckily, we can try to create one! Rather than randomizing who is in your control group, you carefully choose who is in your control group based on who is a good match for your treatment group. For example, you put Portland in your treatment group, and match it with Seattle in your control group. Then put St. Paul in your treatment group and match it with Minneapolis in your control group. Instead of relying on randomization to create two groups that are similar on average, you explicitly choose control units that match your experimental units. You’re not leaving anything up to chance!
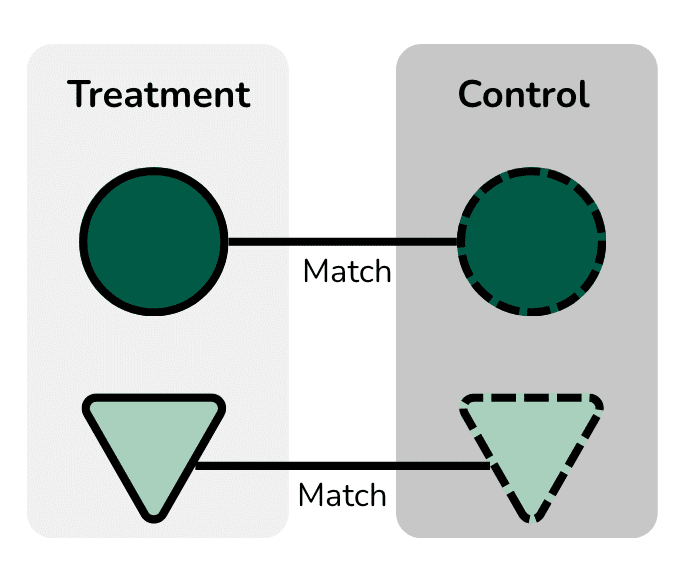
But, when the number of units you have to choose from is small, it can be hard to find an existing perfect or even “good enough” match. So, like Dr. Frankenstein, we can piece together our own match from available regions. This is the methodology behind geo-based experimentation tools like GeoLift by Recast or Meta’s GeoLift package.
Synthetic Controls
Synthetic controls allow you to not only hand select a control group that matches your treatment group, but also to weight each unit in the control group so that pre-treatment, both groups follow the same pattern.
Say you plan to run a country wide out of home (OOH) campaign, and want to compare your observed revenue with the counterfactual (what revenue would have been had you never run the campaign) in order to estimate the causal impact of the campaign. You’re given Australia as a treatment group. Even though no single country is a “perfect match” for Australia, we can take 10% USA, 70% New Zealand, 10% Canada, and 10% Great Britain and get a good approximation of pre-treatment Australian sales. We’ll call this synthetic Australia.
We assume that if Australia and synthetic Australia have similar trends before treatment, they’ll continue to have similar trends, at least in the near term. When we treat Australia, but not synthetic Australia (10% USA, 70% NZ, 10% CA, 10% UK) we can get a close approximation of the causal effect: the difference between the actual (revenue when the Australia OOH campaign is on) and predicted counterfactual (revenue when synthetic Australia does not have an OOH campaign). Synthetic control weights are chosen to minimize the pre-treatment difference between the treatment group and synthetic control.

You may notice that randomization was not required to estimate a causal effect using synthetic controls. Normally, randomization provides a clean way to ensure that the only thing causing some people to be treated and others not is randomization (not confounding variables like demographics). Without randomization, synthetic controls don’t have this guarantee. Instead, it relies on the assumption that if we can predict past data well, we can predict near future data well too.
Because Australia and synthetic Australia are similar in the past, they’ll continue to be similar in the near future (this is why synthetic controls can break down for longer term experiments: the analysis period is no longer the near future and the assumption can break down). Because we do not treat synthetic Australia we assume that its near future data is a good prediction of what actual Australia would have done, had it not had an OOH campaign.
In essence, synthetic controls are a simple prediction model where the inputs are the un-treated units observed data and the output is a forecast of Australia had it not been treated.

Any time we do causal inference, we need an estimate of the counterfactual. Simpler methods, like pure randomization, make similar predictions by assuming that the randomly assigned control group is a good estimate of the treatment group counterfactual (had it not been treated). No matter the method, we’re after one thing: an estimate of the causal effect of treatment that takes our actual observations (e.g. Australia revenue) and compares it with the predicted counterfactual (e.g. our forecast of Australian revenue had the OOH campaign never happened). Synthetic controls provide a simple and interpretable way to make this forecast that doesn’t rely on randomization.