Ad platforms use their attribution models to tell you which campaigns contributed to conversions (leads, sales, subscriptions or whatever is most important to your business). The way they measure attributed conversions is an opinion based on the data available to the platforms. It’s subject to limitations (for example, conversions need to occur within 7 days of clicking for Meta ads), and should not be treated as a fact.
CEOs, on the other hand, care about hard facts. These are measured in what I call canonical conversions: how many customers have we gained, and how much did it cost?
Canonical conversions
Canonical conversions are source-of-truth conversions that represent verifiable business value. For E-commerce it might be a purchase or new customer, for a SAAS it might be a sign-up. Canonical conversions are unambiguous and not bound to any attribution model.
Marketers often ignore canonical conversions and base their decisions on what they see inside ad platforms. This obsession with attribution provides only a single view on what drives a business forward.
Often the metric you’re optimizing for isn’t what makes you money. Conversion events like Add To Carts, Form Submits, or Button Clicks, act as a proxy or indicator metric for the real end of funnel conversion, perhaps because the final event happens offline, days later, or in a different platform. There can be quite a discrepancy across campaigns in how many people get converted from these vanity metrics into cold, hard, cash.
Blended Metrics
Blended metrics – for example blended CPA or blended ROAS, often called MER (Marketing Efficiency Ratio) – should be the starting point for any reporting. If you ever ask the CEO how marketing is performing, they’ll take the total marketing budget and divide it by all sales. They view the world in blended metrics – I spent a dollar and made $2 back – and rarely venture into the messy reality of granular attribution reporting.
To someone at the coal face optimizing campaigns, this may seem naive, but actually it’s more honest. It tells us the direction of travel in terms of volume (number of canonical conversions) and efficiency (cost per canonical conversion), without any allowances made for potentially flawed attribution methods. In other words, are all ships rising with the tide? If not, how can you have really delivered the results you said you did? No matter how clever you’ve been with attribution, it needs to show up in the bottom line.
Platform metrics – for example Google or Meta ad platforms – can be overlaid to on top of canonical conversions to understand how each channel claims to have contributed to the overall number. Looking holistically across the marketing mix, you can spot suspicious behavior, like one channel claiming an implausible share of conversions. The key is not ignoring granular attribution figures, but to sense check them against canonical numbers. By measuring the ratio between platform conversions and canonical conversions, we can track how it changes over time and investigate anything that looks off.
Comparing canonical and platform performance
My agency – Pollenary – runs paid social campaigns for a client selling a high-ticket subscription. In many ways, they are the ideal client: great product, amazing team, and open-minded on how to measure success.
The client measures first-touch attribution to credit the platform that brought the user to the site first. We created a data set that merges this data with the conversion data according to Meta’s attribution model. While neither are correct, what matters is that we’re comparing a fact (verified customers) with the ad platform’s opinion, and can visualize divergence between the two.
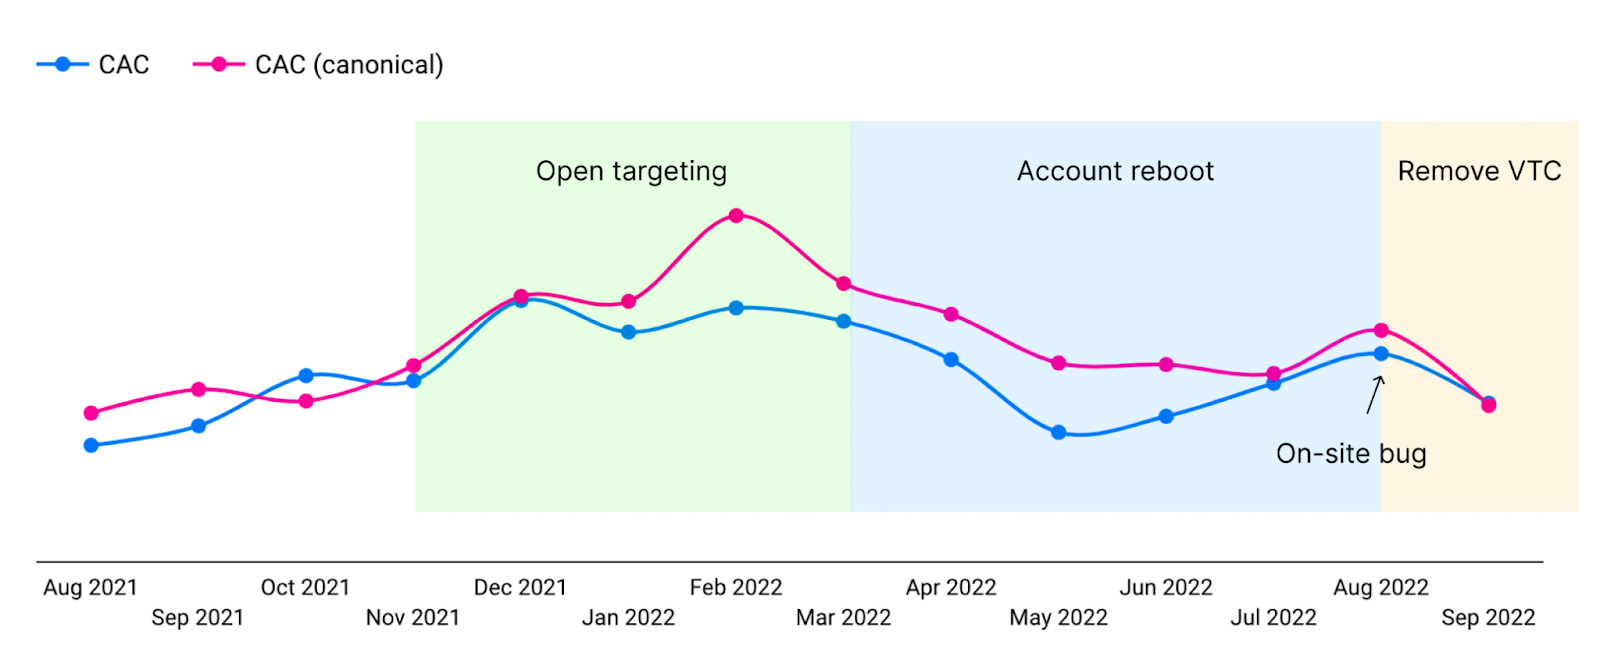
What we found was a significant divergence that coincided with a new “open targeting” audience strategy we implemented. On further investigation we were able to determine that an increased proportion of conversions were view-through conversions, which were invisible to the clients’ click-based attribution.
Our solution was to reverse our audience strategy (in March), and remove view-through attribution from Meta’s optimization entirely (in August). You can see the effect in the numbers: CAC decreased significantly after the change. Removing view-through conversions (VTC) led to a further efficiency gain as measured by canonical conversions.
Use multiple data points to see the bigger picture
In looking to attribute and measure performance, it’s important to look at the bigger picture. Ad platforms will offer their own opinion on how they contributed to business outcomes, which can cloud the decision-making process. If we had simply followed Meta’s view on attribution, performance would have appeared to improve, but in reality the client’s outcomes were worsening. This is where having technical members on the team who can bring data together in Data Warehouses, or using no code tools like Funnel.io to do so, can give you a competitive edge. Note that you can’t even get click vs view through attribution in the Facebook Ads Manager anymore, as it can only be accessed via the API (which is how Funnel gets it). Adding canonical conversions to our reporting allowed us to see the true business impact of our efforts.