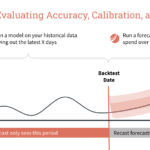
A few years ago I was running Facebook advertising for an eCommerce store selling print-on-demand products across Europe: think posters, framed pictures but later also t-shirts and hoodies.
We were VC-funded, so predominantly cared about growth in the early stages, thinking that focussing our efforts on driving revenue should do the trick. After all, who wants to have to deal with complicated tracking setups and attribution models when they are just getting started.
When the “fashion” category launched, we doubled ROAS almost instantly. Basket values and therefore Average Order Value (AOV) were significantly higher and people converted at a higher rate. So we moved most of our budget to ads promoting fashion products.
When we launched in Sweden and Denmark we had a similar experience: Those Nordic people were buying more and more often. More budget to the Nordic campaigns then?
We don’t compare channels based on revenue alone
Every CMO knows that it is difficult to compare different channels based on their performance. Only because Google Analytics claims a Google Ads is driving most revenue under last click attribution, doesn’t mean that that is where you should be spending more of your budget.
So we either tackle this issue by building better attribution models or, more often than not, we live with the inconsistencies that come with comparing channel revenue side by side. We accept that $100 of Google Ad revenue may not be the same as $100 of Facebook Ad revenue.
While almost every Marketer is aware of these differences per channel, we often forget that there can be way more drastic differences in results per product category or shipping country due to differences in COGS, return rates or even sales taxes / VAT.
What does ROAS mean to you?
It has become common practice to use Return on Ad Spend (ROAS) as the primary metric to measure your ads’ performance.
Ultimately, most companies really do not care about revenue. Yes, as a VC-backed startup for a short period of time top-line growth may be the only thing you care about. But once you mature, you start caring about net profits, contribution margins or even lifetime value.
Going back to our example: As an eCom store, we quickly learned that we truly cared about profit after all variable costs (we can call this contribution margin 2 or CM2). This makes sense as a growing business: If we can make a profit on each order we can use that money to pay our office, servers and salaries. All we need to do is get more orders and eventually we can actually turn a profit after all costs.
You may not care about reaching CM2 profitability and that’s ok. What you have to figure out is what business metric you actually want to optimize for.
High Return Rates + High VAT = Bad
So was it a smart move to shift our budgets towards fashion products in the Nordics?
Well, not so much:
- Fashion products had a 50% return rate compared to less than 3% for wall art products.
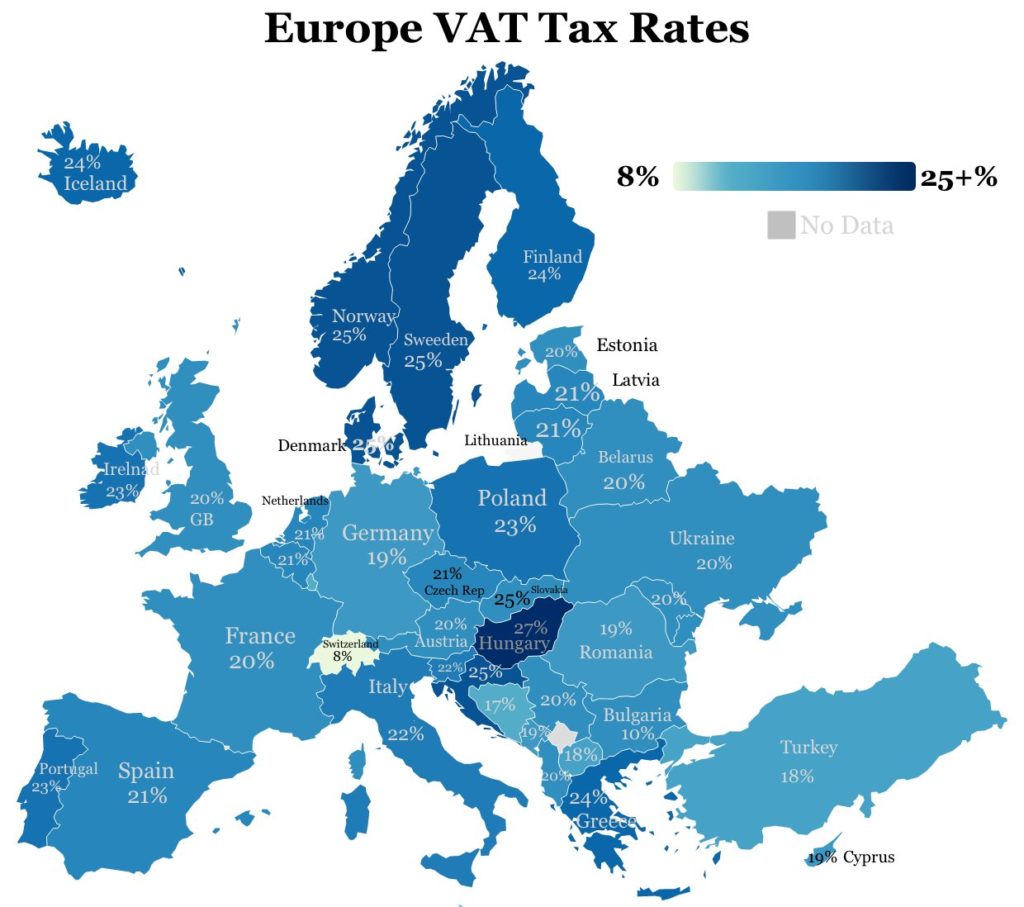
- Sweden and Denmark have a VAT of 25% vs. the 19% were used to in Germany vs. 0% VAT in Switzerland (as tax was handled at the time of import into Switzerland and in addition to our store prices)
A 100€ worth of fashion products sold to the Nordics left a measly 40€ to cover shipping costs, productuction costs and advertising.
Whereas 100€ worth of wall art products sold to Switzerland meant 97€ to cover the same.
We learnt that there are even more factors that can have an impact on profitability:
- Costs of goods sold (COGS) per product type
- Shipping costs per
- Country
- Product category
- Likelihood of becoming a repeat customer based on the customer’s
- Gender
- Location
- Age
- Product Category
So really, not all revenue is created equal.
How can you account for these differences?
When we realized that we were burning through cash betting on selling fashion in the Nordics, we took a pragmatic approach:
We created an Excel file with all major differences for each product category and shipping country: estimated return rates, COGS, VAT.
We then converted the table into JSON and set up a small script in Google Tag Manager to calculate estimated CM2 based on the products’ categories and customer’s country. Once calculated, we let GTM fire a custom Pixel Event to Facebook.
And et voila, we could now optimize our campaigns based on CM2.
What can you do?
- Figure out your one metric that best represents business success
- Figure out where there may be differences in results even when revenue is the same
- Create a way of estimating that KPI and feeding it back to your Marketers
- Use Zapier to add each order to a spreadsheet, set up a formula in the sheet and use Facebook’s Conversion API to return the estimated metric into Ads Manager
- Calculate the metric when importing campaign data into your Data Warehouse (DWH) and start running your meetings focussing on this number instead of revenue
- Use a service like Kitchn.io to join your external data (in a DWH, GA or attribution tool) to take automated actions to increase budgets or bids, not based on revenue but on true business performance.
Simon Kreienbaum is a co-founder at Kitchn.io, a paid social ads automation platform, which lets marketers at companies like Foodspring, Pearmill, and Ladder avoid needless repetitive work when scaling ad accounts.