
Upper funnel channels like Meta Prospecting drive direct sales when someone sees an ad then buys something. Every marketer knows this. But they also create assisted sales through channels like Brand Search. How does that work?
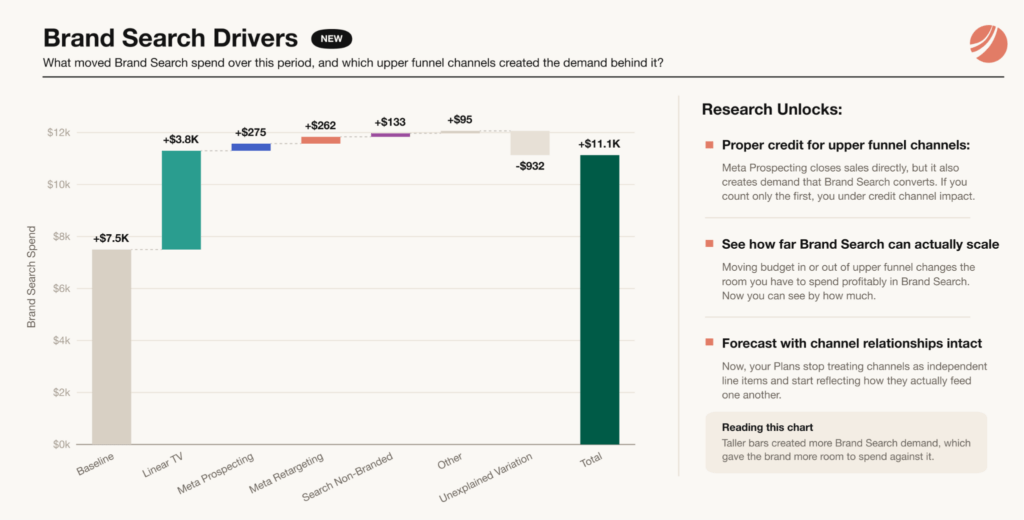
Upper funnel activity often increases query volume for a brand, which increases the ability to spend into Brand Search. That increased spend in Brand Search can contribute additional incremental sales.
So the total impact of an upper funnel channel is the sum of its direct sales plus its assisted sales.
While this relationship has been long-known, the challenge has been accurately estimating it in complex statistical models like an MMM. But the payoff for doing so is immense, because with a more accurate picture a budget holder can:
- Understand the total impact of upper-funnel channels vs. under-selling them by counting just direct impacts.
- See how upper-funnel budget shifts impact the scalability of channels like Brand Search.
- Create forecasts and plans that account for relationships between channels.
We have been modeling these indirect, or assisted effects for years. But this relationship — between two different sources of spend — is important enough that we continue to invest significant research efforts into it. And we’re excited to report that they’ve had a breakthrough.
Modeling search query volume explicitly
Brendan Galdo and Gregor Pirš on our research team identified a way to model search query volume explicitly. To understand why this is important, we need to first acknowledge why changes in Brand Search spend alone offers a limited view into the search demand for a brand.
Spend shifts for branded keywords are impacted by many exogenous factors including a brand’s own bidding decisions, the bids and budgets of their competitors, their keyword strength, their ad strength, broader CPC trends, and a dozen other things. This means a full-channel modeling approach focused on channel spend alone risks mistaking a Brand Search budget shift for a change in upper-funnel media effectiveness.
By modeling search query volume explicitly, our research team was able to separate real increases in search demand from these paid auction dynamics. They validated this method on synthetic data as well as on production Recast models to prove that it outperforms existing solutions.
We’re calling this research Brand Search Drivers because it more accurately estimates which upper funnel channels increase your ability to scale Brand Search. It will be available soon to all Recast users.
Rethinking the DAG
Every Recast model is built on a directed acyclic graph (DAG). It’s a map of what causes what on the causal pathway, and it informs how Recast’s underlying model estimates channel performance.
Up until now, our DAG said that upper funnel channels do two things:
- They drive your KPI directly (ex. new sales, app downloads, customers, etc)
- They drive Brand Search spend, which then drives your KPI as well
That second path is how we’ve always estimated the “assisted” credit that upper funnel channels drive for sales that Brand Search ends up closing. The trouble is that Brand Search spend was doing double duty in that structure. We were leaning on it to represent the search demand for a brand, when what it really measures is how much a brand spent into some amount of query volume (amidst many other auction factors).
So when your Brand Search spend moved because you got more aggressive with a bid or a competitor pulled back on their impression share, the model had no way of separating those actions from a shift in underlying search demand. All it could see was the spend change.
So we gave the model somewhere else to look:

Research into Brand Search Drivers added search query volume as its own node in the DAG, sitting between upper funnel channels and Brand Search spend. It also acknowledges the push of auction dynamics on Brand Search spend from the side, as a latent input we don’t try to observe directly.
Here’s what each of those pieces is doing.
- Upper funnel channels now point at query volume instead of pointing right at spend.
- Brand Search spend still points at your KPI, exactly as it did before, because Brand Search still does real work to close sales.
- Auction dynamics pointing at Brand Search spend is a new piece. It’s an acknowledgement that your bids, your competitors’ bids, and everything else happening in the auction will move your spend around, and that none of that movement tells us much about your upper funnel channels’ effectiveness.
This is a fairly straightforward change in the DAG, but it does a lot of work. Upper funnel channels are now judged on whether they drive sales and increase search demand for a brand – which is what we wanted to measure all along.
Finding a good measure of demand
Adding a query volume node to the DAG is only useful if you can actually measure query volume with clean and reliable data. Figuring out the source of that data turned out to be much of the work and testing.
The obvious first place to look was inside Google Ads itself, at eligible impression volume for Brand Search keywords. It seemed like a natural fit, but it suffers from a similar dynamic to spend in that eligible impressions is an estimate shaped by things like your bids and keyword quality scores, and it only reflects ad auctions your account was in a position to enter. So it isn’t actually a picture of how many people searched for your brand, but a picture of how many searches Google deemed you eligible to bid on.
Google Keyword Planner is cleaner on that front, since it isn’t tied to your account’s auction performance. But it reports data monthly, buckets search volume into ranges, and it groups close keyword variants together – which may be fine for keyword research, but is not precise enough for our modeling.
We found that Google’s own query volume data is the best version of this that exists. It’s daily, is aggregated in a privacy-safe way, and you can configure it to cover your full set of brand keywords. The catch is that you can only get at it from inside Google’s MMM platform, so it isn’t something most brands can simply hand us.
In those cases, Google Trends data works as a stand-in. It’s an anonymized sample of what people actually search on Google, normalized to a 0 to 100 scale, and it has nothing to do with advertising at all. You can pull daily values from it and, best of all, it’s free.
None of which means Google Trends or Google’s MMM data are the only options available. Brand Search Drivers doesn’t care which metric you use, so long as it’s a high fidelity stand-in for how many people are searching your brand. If you have something better, Recast can use it.
None of this structure is specific to paid search. Any measure that sits between upper funnel media spend and a downstream channel can occupy that middle node, as long as you can track it consistently over time.
AI visibility is the obvious next candidate. If you have a reliable measure of how often your brand appears in LLM responses, this same structure can estimate which upper funnel channels are actually moving that visibility and what that investment contributes downstream.
Getting started
Getting started with enhanced Brand Search Drivers modeling is easy. If you have query volume from Google or somewhere else, we’ll use it. If you don’t, we’ll pull Google Trends for your brand keywords and you won’t have to do anything at all.
To discuss implementing this research in your models, just talk to your Recast team.