Model transparency and accountability are foundational to our work at Recast. We openly publish model performance metrics to customers and use them internally to assess and improve the quality of Recast’s media mix models.
Three of these metrics – Median Holdout Accuracy, Marketing Dollars Saved Using Recast, and Average Annual Value per Recast Model – are published on our live accuracy dashboards. This article explains what these performance metrics are, how they’re calculated, and why they’re important to our customers.
Metric 1: Median Holdout Accuracy
Simply stated:
Median Holdout Accuracy – or Forecast Accuracy – is calculated as 1 minus the scaled Continuous Ranked Probability Score (CRPS) on the cumulative predictions and actuals over the forecast period.
How it works in practice:
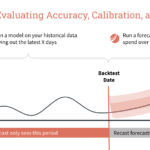
Recast models fully refresh when they receive new data, which for most clients is 1x/week. This creates a “backlog” of previously published models whose predictive accuracy can be assessed.
Holdout accuracy tests take each of these models published over the past 7 to ~90 days and ask: “If this model had been used to forecast recent performance, how close would its predictions have been to reality?”
Said more precisely: If we trained a model 60 days ago, how well does that model do at predicting the KPI over the next 60 days (data that we now have, but that the model has never seen)?
The metric published in the live accuracy dashboard is the median holdout accuracy for every Recast model that has received new data over the last thirty days – in practice, more than 1,000 models are typically backtested every 30 days!
Why This Matters:
Holdout accuracy tests help us understand how well Recast models are doing at predicting the future on data they have never seen before. We believe this is the most important way to evaluate the accuracy of a media mix model.
If a model can’t predict the future on data it hasn’t seen before, it is not robust and should not be used to drive budget decisions. That’s why this score is front and center in the Recast dashboard: we believe clients should be able to build trust in the forecasting accuracy of their models before they use them for decision-making.
More information: How we do holdout testing at Recast
Metric 2: Marketing Dollars Saved Using Recast
Simply stated:
This cumulative metric is a dollar estimate of how much more Recast customers would have needed to spend to achieve the same KPI results without using Recast’s model-based recommendations.
How it works in practice:
To calculate total Marketing Dollars Saved, Recast does the following for each client:
- Recast estimates the business-as-usual (BAU) spend a customer would have deployed without using the platform’s recommendations, both in total and for each marketing channel.
- It compares that BAU plan with the customer’s actual spend over a given time period and Recast’s recommended spend for each marketing channel.
- Recast then isolates the differences where the customer’s actual decisions were aligned with the platform’s recommendations (e.g., increasing spend in media channels that Recast suggested to increase).
- Then, Recast calculates how many incremental conversions those aligned decisions led to.
- To convert these calculations into a common dollar unit across clients with different KPI’s, Recast estimates how much those incremental conversions would have “cost” at the customer’s average paid CPA.
- The difference between that cost and what was actually spent with Recast is counted as marketing dollars saved.
- To avoid double-counting (due to overlapping time periods or multiple models covering the same budget), Recast applies an adjustment factor to the total.
Why This Matters:
Proving the ROI of an MMM is extremely challenging. This metric translates complex model-driven insights into real monetary impact. It quantifies how much budget Recast helps marketers save by reallocating spend more efficiently.
Tracking it helps validate that the platform not only improves marketing performance, but does so in a way that directly impacts the bottom line.
Metric 3: Average Annual Value per Recast Model
Simply stated:
This metric is the average dollar value Recast delivers annually for each production model deployed.
How it works in practice:
Similar to the Marketing Dollars Saved calculation, this metric is based on actual versus estimated BAU decisions and their incremental impact.
For a given model and time period, Recast:
- Identifies the net dollar impact from aligned decisions.
- Divides that number by the number of days in the period to get a per-day value.
- Multiplies by 365.25 to project an annualized value.
- Makes sure to avoid double-counting (due to overlapping time periods in model refreshes).
These value metrics are then averaged across all production models in Recast’s system to produce the dashboard metric.
Why This Matters:
This metric shows value per Recast model—a useful benchmark both internally and externally. It helps demonstrate how much impact each deployed model drives on average, giving stakeholders a sense of the ROI Recast delivers at the unit level.
Wrapping Up
Transparency, accountability, and model quality are pillars at Recast. Our model-building process is designed to produce robust, accurate media mix models that our clients trust to make their most important marketing decisions.
Model performance metrics like these help us internally assess the health and quality of these models, but more importantly, they allow our customers to build trust in the stability and forecasting ability of Recast.
Have questions about how these metrics are calculated? Reach out to us at info@getrecast.com.