Many marketers assume their brand search campaigns drive conversions, but there’s a critical question they need to ask: would those customers have found their brand and purchased anyway? Brand search captures high-intent customers already looking for your product, making it difficult to distinguish between truly incremental revenue and sales you would have captured organically.
With GeoLift by Recast, you can measure the incremental lift from your brand search spend by structuring experiments that compare markets where you spend into brand search against similar markets where you don’t. The following guide will walk through exactly how to use GeoLift by Recast to design and analyze your own experiment to answer the question: Is my brand search spend actually incremental? Before starting, you’ll need to create your own GeoLift by Recast trial account HERE. Trial accounts are free, and do not require a credit card or commitment.
Prerequisites
Before you begin, there are a few things you’ll need:
- Historical data access: At least 90 days (preferably 12 months) of total daily revenue or conversion data broken down by geography. This data should come from your own analytics system, data warehouse, or business intelligence tools and should include all sales data. This should be your backend source of truth for conversion data and not just in-platform data from Google Ads, Bing, or the other platform you want to run a brand search incrementality test on.
- Ability to maintain test conditions: You need organizational willingness to commit to keeping the recommended spend change consistent for the length of the experiment (typically 30-90 days) in the platform you test the incrementality of brand search on. You should not make major marketing changes within this platform that might impact efficiency or revenue during the test.
- Budget flexibility: For experiments designed to increase overall platform spend, you need additional budget to allocate. For spend decrease tests, you need willingness to pause/reduce spend in test geos and understand that this may reduce total conversion volume for the business in the short term.
- Minimum thresholds: If you’re running a spend decrease or holdout test with relatively low conversion volumes or budget in Google Ads or Bing, it may be difficult to generate a large enough effect to detect with statistical confidence. GeoLift by Recast’s “Design” feature will help you determine whether your current levels are sufficient – we’ll walk through this below.
Step 1: Organize your Data
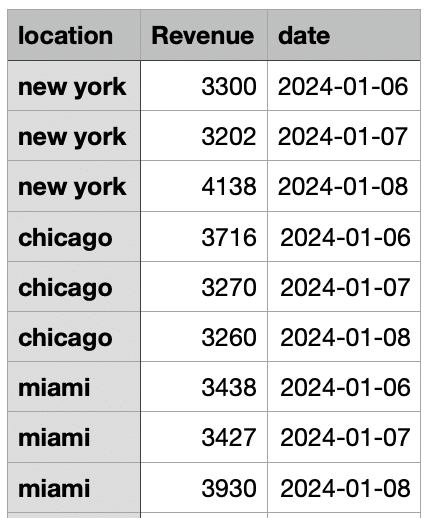
To begin the design of your brand search incrementality test, start by exporting at least 90 days (ideally 12 months) of daily sales data. This data could come from your own data warehouse or wherever you aggregate sales data of directly from your Shopify or Amazon sellers platform. It should include all sales data, not just sales attributed to Bing or Google Ads, and contain the following 3 columns:
- Date: You can use any format as long as it is numerical and doesn’t contain letters.
- Location: You can use any location type to segment data including by state, DMA, city, or zip code, but you should choose a segment type that is addressable to target in the brand search platform. For Google Ads and Bing, we recommend State, DMA, or City level segmentation.
- KPI: Total revenue or conversion counts for each day. If you’re measuring conversions instead of revenue, count one conversion per order.
Here’s an abbreviated example of what this should look like:
Important Notes:
- If a geography/date combination has no sales, you can omit it from the data compilation (GeoLift by Recast will assume a 0 on these respective locations/days)
- If inputting data that uses zip codes, GeoLift by Recast will automatically convert these to commuting zones
Step 2: Design Your Experiment in GeoLift by Recast
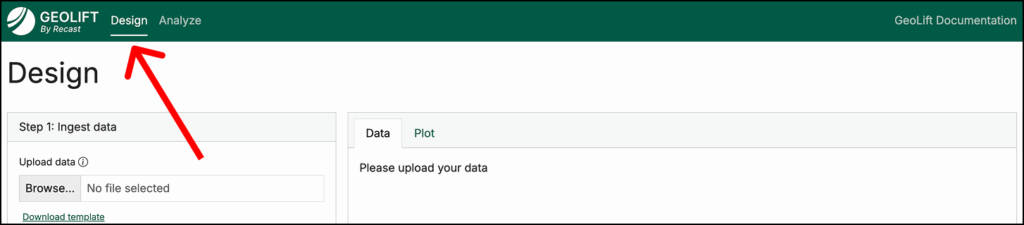
Once your data is compiled, it’s time to open GeoLift by Recast and navigate to the Design tab (pictured above).
In this tab, you can begin designing your brand search incrementality test by doing the following:
- Upload the CSV you prepared in Step One
- Map the columns in your CSV to Date, Location, and KPI, specify the date format used, then click Ingest Data
- This will generate visualizations; review these to check for data quality issues (for example, if there are any large and unexpected revenue spikes in your data)

Configure Your Analysis:
Once you’ve successfully uploaded historical conversion data and reviewed visuals to confirm there are no data errors, it’s time to configure the specifics of your experiment.
Here, you will inform the design of your brand search incrementality test (increasing or decreasing spend, test budget, target experiment length, etc.) so that it meets the constraints of your business.
To do this:
- Choose between spend increase or spend decrease:
- Spend Increase: Run a spend increase incrementality test if you’re thinking about scaling up brand search and want to measure its incrementality at greater spend scale. A spend increase test often is not feasible for measuring brand search–such as in a case where you already own +90% of impression share.
- Spend Decrease: This is more common when testing brand search, as it will show you how much of your branded traffic is truly incremental versus traffic you’d capture organically even without paid search.
- Select if you’re measuring revenue or conversions.
- Approximate Channel ROI/CPA: This is your estimate of brand search’s incremental ROI or CPA. If you’re not sure what to enter, use a conservative estimate. Read more on this here.
- Experiment Length: The target number of days you will run your brand search incrementality test (30-60 days is generally enough for a brand search test).
- Cooldown Period: Days after the experiment to observe delayed conversions (~7-14 days). Read more on cooldown periods here.
- Approximate $ for Test: How much you plan to increase or decrease spend during the test period.
- Number of Test Geos: We recommend a minimum of 2 geographies, all the way up to half your total geographies. (e.g. if you include data from 30 states, your test could range anywhere from 2-15 states).
Once your configuration is complete, there are a few more steps to take to finish designing your brand search incrementality test.
Click “Generate test markets”, and review the recommended geography combinations. These are candidate test markets with “simulated” hypothetical experiments and their results, including both the simulated lift as well as what a theoretical experiment would have estimated as the lift.
- We recommend selecting the geos with the highest estimated lift and the lowest absolute % error.
- If Recast is unable to find test groups that result in low absolute % error and statistical significance, it will fail to generate the candidate test markets and instead recommend tweaking your configuration settings. Increasing the spend amount, lengthening the number of days (while keeping daily spend the same), and increasing the number of test markets are all ways to increase the statistical power of your brand search incrementality test design.
- The “Simulated Experiment graph” pictured below shows the expected conversions over time in both the test and control geographies. It should help you visualize what to expect during your actual experiment and validates that the proposed test design can detect meaningful differences between your test and control groups. The difference between these two groups can be seen in the yellow shaded area–looking at the difference between the control line (grey) and the test line (green).

- Select a group of test geographies that meets your budget constraints and minimizes bias–for example, some external factor in a certain geography that might lead to a spike or sharp decline in revenue.
- Click “Deep Dive with these locations”, and you will receive two test plans: a Baseline Confidence Plan and High Confidence Plan. These are two different test design options that when implemented, will allow you to measure the incrementality of brand search campaigns.
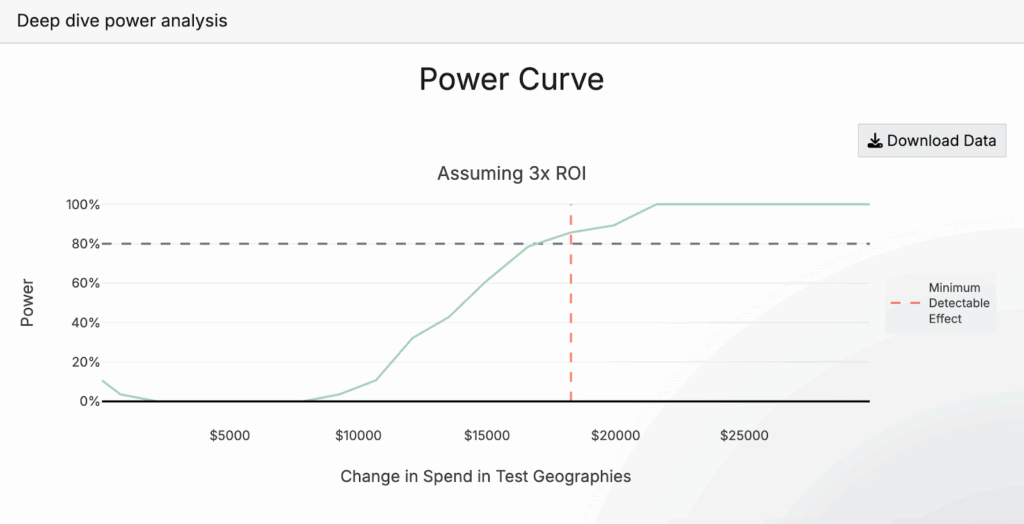
- The Power Curve (pictured below) will show you how much you need to adjust spend in brand search campaigns during the test period in order to achieve a statistically significant test. 80% power is the bare minimum we recommend, but often our baseline recommendation will be above this, as is the case in the image below. If the results aren’t sufficient, you can increase experiment length (while keeping daily spend change the same), increase spend amount, or increase the number of test geos. For more on how to think about experiment power, we recommend this section of our documentation.
Determine which of the two test plans you will follow based on your organization’s risk tolerance, the business impact of potential spend changes, and the level of confidence leadership requires to act on results. Use the export buttons to save your test design which you can reference during execution.
Step 3: Execute Your Experiment
Once your incrementality test is selected for brand search, it’s time to implement its recommendations in Google, Bing, or the other platform you’re testing the incrementality of brand search in. This means adjusting brand search spend and targeting.
If you’re running a spend decrease test in which you’re completely holding spend in certain geographies, we recommend continuing to run your existing campaigns, but excluding the test geographies from targeting.
If you are running a spend increase test, or if you’re running a spend decrease test (but not completely holding spend), we recommend the following:
- Continue running your existing evergreen brand search campaigns, but exclude the test geographies from targeting for the duration of your experiment.
- Create a second campaign with the same settings as your evergreen campaign, implement the spend increase or decrease recommended in your test design, and target only test geographies with this campaign.
- To do this, pull your historical spend data from Google Ads or Bing for the test geographies during the same time period used in the data you uploaded previously (ideally the most recent 90 days to 1 year). Calculate the total spend in each test geography, then determine the average daily spend across all test geos combined. Increase or decrease spend from this baseline amount based on what you selected when designing your experiment, using this as your daily budget for the test campaign, and let Google Ads or Bing distribute it proportionally across the test geographies as it did historically.
- Ensure ad copy, targeting parameters, optimization goals, and other campaign settings remain consistent across test and control geography campaigns, then set the new campaign live.
Monitor Throughout:
You’ve now started to run a brand search incrementality experiment! Remember, the big idea here is that we’ve split brand search delivery into test and control geographies, have implemented a change between these two geographies (in this case spend), and will then use differences in backend conversions between these two geography groups to estimate the incremental impact of brand search.
There are a few things to do as your experiment runs:
- Track actual spend to ensure you’re following the plan.
- Watch for external factors that might confound results (ex. major promotions, PR events, stockouts, etc.)
- Don’t make other major changes during the test period–the key is maintaining stable conditions so that pausing branded search is the only systematic difference between the test and control geographies. Otherwise, you’re introducing confounders that muddy the causal relationship you’re trying to measure.
Maintain Consistency:
- Run the full test duration plus the recommended cooldown period.
- Resist the urge to peek at results early or make changes mid-test.
Step 4: Analyze Results (After Test Completion)
After your experiment has concluded, it’s time to analyze results so that we can estimate the incrementality of brand search.
To do this, start by exporting post-test data:
Follow the same process as Step 1 to organize data, but this time, the data you export should span from the earliest date included in the experiment design phase, all the way through to the end of the cooldown period. You will use the same columns (location, date, and KPI).
Note: to export spend data by day and location in Google, follow our quick guide here.
Navigate to the Analyze tab of GeoLift by Recast (at the top, next to “Design”) and then:
- Upload your complete dataset. This should cover the entire experiment timeline: starting with the earliest date from your design phase and extending through the final day of your cooldown period.
- Select your test geographies and input the other configurations of your experiment, and click “Analyze Experiment”.
The first chart you will see provides the results of your experiment. We’ll go into more detail on how to interpret these results in the next section.

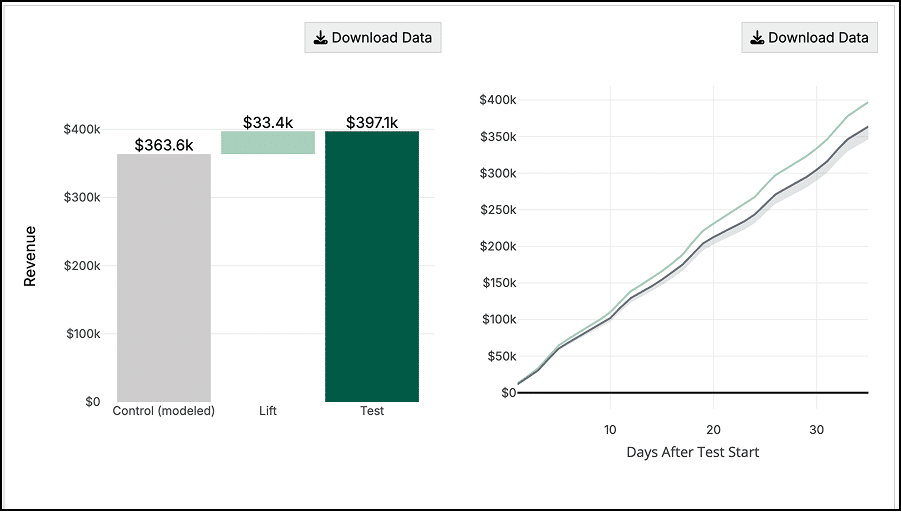
The bar chart (below) shows the modeled “control” geography revenue in gray, the incremental lift estimated from the experiment (in light green) and the actual observed revenue in the test geographies (dark green).
The line graph next to it shows how the test evolved over time, showing the cumulative revenue observed between test and control groups. In this case, we can see revenue from the test geographies separating further and further from the control geographies as the test progresses.
The last line graph (below) shows the revenue by day for both the test and control groups – the left-hand side with the white background shows that prior to the start of the test, the control group matches the test group revenue almost perfectly.
On the right hand side (yellow and gray backgrounds) we can see how the test group starts to “separate” from the control group which we infer is due to the marketing intervention.

Taking Action with your results
Anyone can run an incrementality test, but interpreting and actioning results isn’t quite as simple. The same statistically significant result might lead to different decisions depending on your business context, risk tolerance, and strategic priorities. Here’s how to think through different outcomes:
When Results Are Not Statistically Significant
A non-significant result doesn’t mean your test failed – it means you need more evidence before making a confident decision. Look at the directional signal: a +15% effect (p=0.15) suggests your brand search campaigns are likely driving incremental value but you need a more powerful test to confirm it. Consider running a longer test, increasing the spend change, or adding more test geographies to boost statistical power. Conversely, if you see a -2% effect that’s not significant, the intervention probably isn’t worth pursuing, even without statistical certainty.
When You See No Lift (and It’s Statistically Significant)
If your test shows near-zero lift with statistical significance, your brand search spend is likely not incremental and is capturing demand that would have converted organically. This is one of the most valuable findings you can get as it reveals a budget reallocation opportunity. Consider gradually reducing brand search spend and reinvesting those dollars into channels with proven incrementality, or testing whether you can maintain brand visibility with lower bids or more restrictive match types.
When You See Statistically Significant Lift
This is where the real strategic work begins. The size of the lift, your brand search ROI, and your incrementality percentage all matter for decision-making:
- Large positive lift (spend increase test): If expanding brand search drove substantial incremental revenue at an acceptable ROI, you have a clear signal to scale. Consider gradually increasing spend while monitoring for diminishing returns.
- Large negative lift (spend decrease test): If pausing or reducing brand search caused a significant revenue drop beyond what you stopped spending, your brand search is highly incremental. Maintain or potentially increase investment, and consider testing expansion into new brand keyword variations or geographies.
- Moderate lift: This is where business judgment becomes critical. A 10% lift might be worth scaling if your customer lifetime value is high, but not if you’re operating on thin margins. Calculate the fully loaded incrementality – accounting for the lift, the cooldown period effects, and your CAC – then compare against alternative uses of that budget.
Don’t forget to examine the confidence intervals around your lift estimate. Wide intervals mean more uncertainty about the true effect. Your point estimate might show strong incrementality, but if the lower bound of your confidence interval suggests break-even or negative performance, you need to factor that risk into your decisions. When intervals are wide, a follow-up test can help narrow your uncertainty before making large budget shifts.
For a deeper exploration of how to interpret lift magnitude, calculate true incremental ROI, and make budget decisions based on your specific business context, see our complete guide on the art of interpreting lift test results HERE.
Conclusion:
The incrementality of brand search is an often-overlooked question in marketing, yet it can unlock significant budget optimization opportunities. By following this guide, you can design and execute a rigorous geo-based experiment in GeoLift by Recast to determine whether your brand search spend is truly driving incremental conversions or simply capturing demand that would have converted anyway.
Whether you discover high incrementality (validating continued investment) or low incrementality (revealing reallocation opportunities), you’ll have data-driven answers to guide your marketing strategy.